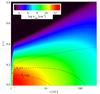
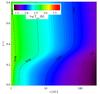
Fig. 10
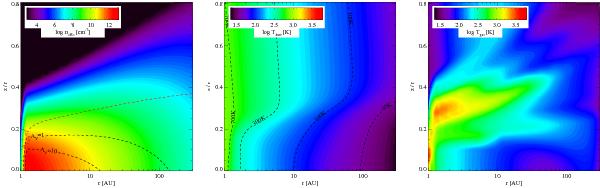
Density, Tdust, and Tgas structures for model 1a. The contours in black dashed lines in the density panel show the location of AV = 1 and 10 from z = ∞. The red dashed lines mark the location of the radial AV = 1 calculated from Rin. In the middle panel various dust temperature contours are shown in black dashed lines. In our models, Tdust and Tgas are not equal.
Current usage metrics show cumulative count of Article Views (full-text article views including HTML views, PDF and ePub downloads, according to the available data) and Abstracts Views on Vision4Press platform.
Data correspond to usage on the plateform after 2015. The current usage metrics is available 48-96 hours after online publication and is updated daily on week days.
Initial download of the metrics may take a while.