Fig. 5
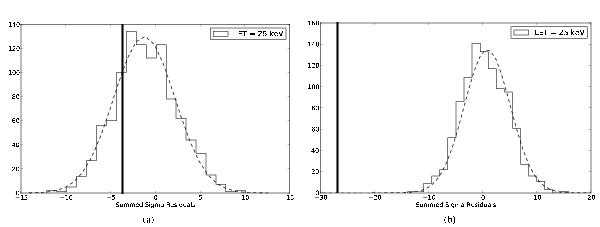
Histograms of summed residuals below 25 keV obtained from time-integrated simulations of a perfect Band function. The dark line shows the value of the data for that GRB. a) The value of the deviation for GRB 080817A is − 3.6. The mean and the standard deviation of the simulated distribution are − 1.1 and 3.4 respectively. In this case the data does not deviate significantly from the simulated distribution and has a normalised deviation of − 0.7σ. b) The value of the deviation for GRB 090424 is − 25.8 compared to the simulated distribution with a mean and standard deviation of 0.4 and 4.3 respectively. The data deviates significantly from the simulated distribution with a normalised deviation of − 6.1σ.
Current usage metrics show cumulative count of Article Views (full-text article views including HTML views, PDF and ePub downloads, according to the available data) and Abstracts Views on Vision4Press platform.
Data correspond to usage on the plateform after 2015. The current usage metrics is available 48-96 hours after online publication and is updated daily on week days.
Initial download of the metrics may take a while.