Fig. 4
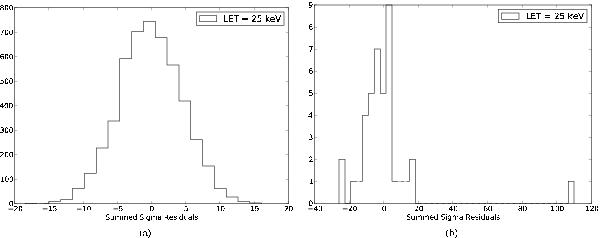
Comparing the time-integrated data to a simulated distribution. a) Combined distribution of low-energy deviations of 5 individual GRBs assuming a perfect Band function (no deviations present). The extrapolated fit method was used with LET = 25 keV. b) The low-energy residuals of the GRBs in the sample that survived the data cuts (see Sect. 3.5) for LET = 25 keV. The data distribution b) is broadly similar to the simulated distribution a). The data point outside the main data distribution (on the right) is GRB 090902B.
Current usage metrics show cumulative count of Article Views (full-text article views including HTML views, PDF and ePub downloads, according to the available data) and Abstracts Views on Vision4Press platform.
Data correspond to usage on the plateform after 2015. The current usage metrics is available 48-96 hours after online publication and is updated daily on week days.
Initial download of the metrics may take a while.