Fig. 1
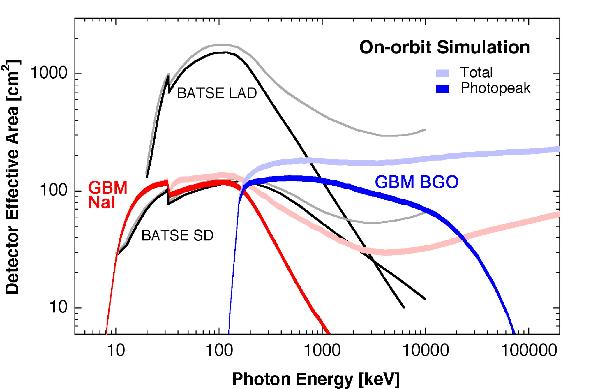
Plot comparing the effective areas of GBM v BATSE per detector. The total area exposed to a particular sky direction depends on the orientation of each detector and number of detectors exposed. At low energies the GBM NaI detectors have more effective area than the BATSE SDs and at high energies the GBM BGO detectors have more effective area that the BATSE LAD (Meegan et al. 2009). The dark lines represent the photopeak effective area where the detected energy is the same (within the energy resolution) as the incident energy and the lighter lines represent the total effective area which includes the photopeak plus the cases where the instrument detects only part of the incident photon energy. (A colour version of this figure is available in the online journal.)
Current usage metrics show cumulative count of Article Views (full-text article views including HTML views, PDF and ePub downloads, according to the available data) and Abstracts Views on Vision4Press platform.
Data correspond to usage on the plateform after 2015. The current usage metrics is available 48-96 hours after online publication and is updated daily on week days.
Initial download of the metrics may take a while.