| Issue |
A&A
Volume 550, February 2013
|
|
|---|---|---|
| Article Number | L2 | |
| Number of page(s) | 4 | |
| Section | Letters | |
| DOI | https://doi.org/10.1051/0004-6361/201220696 | |
| Published online | 21 January 2013 | |
GTC OSIRIS z-band imaging of Y dwarfs
1 Instituto de Astrofísica de Canarias (IAC), Calle Vía Láctea s/n, 38200 La Laguna, Tenerife, Spain
e-mail: This email address is being protected from spambots. You need JavaScript enabled to view it.
; This email address is being protected from spambots. You need JavaScript enabled to view it.
; This email address is being protected from spambots. You need JavaScript enabled to view it.
2 Departamento de Astrofísica, Universidad de La Laguna (ULL), 38205 La Laguna, Tenerife, Spain
3 Consejo Superior de Investigaciones Científicas, CSIC, Spain
Received: 5 November 2012
Accepted: 28 December 2012
Abstract
Aims. The aim of the project is to contribute to the characterisation of the spectral energy distribution of the coolest brown dwarfs discovered to date, the Y dwarfs.
Methods. We obtained z-band far-red imaging for six Y dwarfs and a T9 + Y0 binary with the OSIRIS (Optical System for Imaging and low Resolution Integrated Spectroscopy) instrument on the 10.4-m Gran Telescopio de Canarias (GTC).
Results. We detect five of the seven known Y dwarfs in the z-band, infer their optical-to-infrared colours, and measure their proper motions. We find a higher dispersion in the z − J and z − H colours of Y0 dwarfs than in T dwarfs. This dispersion is found to be correlated with H − w2. The high dispersion in the optical-to-infrared colours of Y dwarfs and the possible turnover towards bluer colours may be a consequence of the presence of sulfide clouds with different thicknesses, the depletion of alcalines, and/or gravity effects.
Key words: stars: low-mass / brown dwarfs / techniques: photometric
Based on observations made with the Gran Telescopio Canarias (GTC), installed in the Spanish Observatorio del Roque de los Muchachos of the Instituto de Astrofísica de Canarias, in the island of La Palma.
© ESO, 2013
1. Introduction
The classical stellar sequence (Morgan et al. 1943) has now been extended to include very cool objects that bridge the gap between brown dwarfs and planets, thanks to the advent of the wide infrared survey explorer (WISE; Wright et al. 2010) satellite. The “Y” class, originally proposed by Kirkpatrick et al. (1999), now consists of 15 members (Cushing et al. 2011; Liu et al. 2011; Kirkpatrick et al. 2012; Tinney et al. 2012) with spectral types equal to, or later than, Y0 (tentative classification) and effective temperatures below 500 K. Two additional candidates have been reported, but their faintness currently hampers spectral typing (Liu et al. 2012; Luhman et al. 2011).
The number of late-T dwarfs with spectral types later than T6 has increased dramatically over the past few years thanks to large-scale surveys such as the UKIRT infrared deep sky survey (UKIDSS; Lodieu et al. 2007; Pinfield et al. 2008; Burningham et al. 2009, 2010a,b), the Canada-France-Hawaii brown dwarf survey (Delorme et al. 2008a,b; Reylé et al. 2010; Albert et al. 2011), and WISE (Kirkpatrick et al. 2012). The T/Y transition is characterised by a rapid shift of the peak of the spectral energy distribution from the near-infrared to the mid-infrared and by narrower peaks in the H band (Cushing et al. 2011) with the possible disappearance of the potassium absorption beyond 0.7 microns (Leggett et al. 2012). Because of to their nature and low temperature, it is important to characterise their spectral energy distributions from the optical to the mid-infrared to understand the chemistry at play in these cool atmospheres.
Our goal is to contribute to the spectral energy characterisation of the Y dwarfs, pushing the limits of the gran telescopio de Canarias (GTC). This letter describes the optical imaging obtained for six Y dwarfs with OSIRIS (Optical System for Imaging and low Resolution Integrated Spectroscopy; Cepa et al. 2000) on the 10.4-m GTC. We present the imaging campaign and the associated data reduction and astrometry. We expose our results and place them into context with respect to the spectral energy distributions of T dwarfs (Leggett et al. 2012).
GTC/OSIRIS astrometry, photometry (or 3σ lower limits), observing information, and photometry for six Y dwarfs and a T9 + Y0 binary.
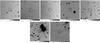 |
Fig. 1 Finding charts for the six Y dwarfs and the T9 + Y0 binary imaged in Sloan z with GTC/OSIRIS. North is up and east is left. Images are 1 × 1 arcmin. Targets are ordered by increasing right ascension from left to right starting from the top left corner. The open circles have a radius of five arcsec and mark the WISE position of the Y dwarfs, showing the motion of the object when detected (small red circle with two arcsec radius). |
2. Far-red optical imaging
2.1. Observations
The OSIRIS instrument is mounted on the 10.4-m GTC operating at the Observatory del Roque de Los Muchachos (La Palma, Canary Islands). The detector consists of two 2048 × 4096 Marconi CCD42-82 separated by an 8 arcsec gap and operates at optical wavelengths, from 365 to 1000 nm. The unvignetted instrument field-of-view is about 7 by 7 arcmin with an unbinned pixel scale of 0.125 arcsec. We employed a 2 × 2 binning because it is currently the standard mode of observations.
We imaged six of the seven Y dwarfs published by Cushing et al. (2011) and the T9+Y0 binary resolved by Liu et al. (2012) using the Sloan z filter available on OSIRIS. Table 1 provides the original names with the first four digits of the right ascension and declination as provided in Cushing et al. (2011) along with their current spectral types (Kirkpatrick et al. 2012). This information is supplemented with the coordinates measured on the GTC OSIRIS images (when the target is detected), the z-band magnitudes with their associated error bars, the dates of observations, and the numbers of individual images with their respective integration times in seconds. Figure 1 shows the GTC OSIRIS finding charts (two arcmin a side) of all the observed objects (circled) with north up and east to the left. Table 1 also lists revised J and H magnitudes (Leggett et al. 2013) and the associated z − J colours plotted in Fig. 2.
The observations were conducted on 15 and 17 June, 6 and 13 August, 3, 5, 9, and 16 September, and 15 December 2012. All observations were conducted under average seeing of 0.8–1.3 arcsec, photometric or clear conditions, grey time, and airmass less than 1.5. Bias and skyflats were obtained during the afternoon or morning of the respective nights. For each Y dwarf, we obtained three to five series of ten frames with 50 s on-source individual integrations, except for the coolest (WISE J1828 + 2650 tentatively classified as > Y2; Kirkpatrick et al. 2012), for which we repeated the series four times to try to detect the object in the z-band and for WISE J1217 + 1626 AB, for which we obtained three series of five frames of 60 s.
2.2. Data reduction and photometry
We reduced the OSIRIS Sloan z-band images in a standard manner with IRAF1 (Tody 1993). First, we subtracted the mean bias and divided by the normalised averaged master skyflat to each individual science frame. Then, we combined each set of ten images taken without dithering, and finally we combined those sets, applying the offsets to create a master science frame. In the case of WISE J1217 + 1626 AB, images were sky-subtracted before the combination.
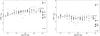 |
Fig. 2 z − J (left) and z − H (right) colours of Y0 dwarfs (filled dots for detections and arrows for lower limits) as a function of spectral type compared to the colours of late-T dwarfs from UKIDSS (diamonds; Burningham et al. 2010b), Sloan (asterisks; Golimowski et al. 2004; Knapp et al. 2004; Chiu et al. 2006), Canada-France brown dwarf survey (squares; Albert et al. 2011), and the sample of Leggett et al. (2013, triangles). |
We photometrically calibrated the z-band images with Sloan standard fields (Smith et al. 2002) or with Sloan images of the same field, using point sources with photometric errors below 0.02–0.05 mag. We measured instrumental magnitudes for 5 to 10 stars in those fields and derived zero points ranging from 27.976 ± 0.037 to 28.091 ± 0.049 mag.
We detected four of the six Y dwarfs and the T9+Y0 binary (unresolved in our images) with OSIRIS in the z-band (Table 1; Fig. 1). We measured the photometry of the closest source to the nominal position of the WISE source (Table 1), except for WISE J1410 + 1502 and WISE J1217 + 1626 AB, which have moved beyond the five-arcsec circle drawn in Fig. 1 due to their high proper motion (~2.5 arcsec/yr). To measure the magnitudes, we performed aperture and point-spread function (PSF) photometry using DAOPHOT in IRAF because of the presence of objects close to some of our targets. We chose an aperture equal to ~ 3 times the full-width-at-half-maximum and checked that the target was well-subtracted by our PSF analysis without residuals. We transformed the instrumental magnitudes into apparent magnitudes using the zero-points derived for the photometric standard fields observed on the same night. The final calibrated magnitudes of the four Y dwarfs detected on the OSIRIS images are given in Table 1. For the remaining sources, we list the 3σ lower limits (Table 1) computed from the root-mean-square of the sky at the nominal position of the target compared to the peak of the flux of three nearby (non-saturated and isolated) stars. After averaging all images for WISE J1828 + 2650, we can set a lower limit of z > 24.46 mag, translating into z − H > 1.6 mag (and z − J > 0.9 mag) for this (tentative) Y2 dwarf.
2.3. Astrometry
We astrometrically calibrated the combined science frames with IRAF (daofind, ccxymatch, and ccmap routines) using bright point sources from 2MASS (Cutri et al. 2003) or SDSS DR8 in the case of WISE J1405p5534. We typically found 50–100 stars (depending on crowding) in the OSIRIS field-of-view, resulting in an astrometric calibration better than 0.1 − 0.15 arcsec. The GTC OSIRIS coordinates (right ascension and declination) of the five objects detected in the z-band are listed in Cols. 2 and 3 of Table 1. We measured proper motions, consistent with the values quoted by Marsh et al. (2013) and Liu et al. (2012), thanks to the 2.0–2.5 year baseline between the GTC and WISE observations. The error bars of each component of the proper motion take into account the WISE astrometric accuracy (0.15–0.17 arcsec) and conservative errors on the GTC centroid of 0.15 arcsec (Table 1). We find high motions as expected for objects lying at distances of only a few parsecs.
3. Discussion and conclusions
We reported in this letter the first far-red optical detection of four Y0 dwarfs and the unresolved T9+Y0 binary from Liu et al. (2012), which are among the coolest brown dwarfs known to date. All four Y0 dwarfs with z-band detection have magnitudes in the range 22.8–24.1 mag, implying z − J and z − H colours spanning 2.7–5.2 mag and 2.3–5.4 mag, respectively (Fig. 2). We also presented lower limit of z − J of 2.79 mag and 0.98 mag for WISE J1405 + 5534 (T0pec?) and WISE J1828 + 2650 ( > T2), respectively.
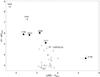 |
Fig. 3 (z − H, H − w2) colour–colour diagram for our targets (filled dots and arrows for lower limits), late-T dwarfs (open triangles; Leggett et al. 2013), and UGPS J0722227.51 − 054031.2 (open triangle with error bars; Lucas et al. 2010). |
Figure 2 shows the z − J and z − H colours of the Y0 dwarfs as a function of spectral type (black dots with error bars and arrows for lower limits) along with the colours of T dwarfs. Here we adopted a spectral type of T9.5+/–0.5 for the binary T9+Y0. The dispersion observed for Y0 dwarfs is greater than for T dwarfs. We added to this plot UGPS J072227.51 − 054031.2 classified as T10 by Lucas et al. (2010) and Leggett et al. (2012), but proposed as the T9 standard by Cushing et al. (2011).
Figure 3 displays the (z − H, H − w2) colour-colour diagram for the four Y0 dwarfs and the T9+Y0 binary (filled dots) detected in z and for the two sources with upper limits (left-pointing arrows). This plot takes into account the improved near-infrared photometry from Leggett et al. (2013), compared to the original values in Table 2 of Kirkpatrick et al. (2012). We note a trend towards bluer colours with increasing H − w2 from late-T dwarfs to Y0 dwarfs, except for WISE J0146 + 4234, which looks peculiar in all diagrams. This trend seems to start off around a spectral type of ~T8 and agrees with the bluer Y − J colours observed with cooler temperatures for the Y class and the excess of flux in the 840–940 nm region in the spectrum of WISE J2056 + 1459 compared to UGPS J072227.51 − 054031.2 (Leggett et al. 2013). The T9+Y0 binary from Liu et al. (2012) shows an intermediate position between late-T and Y0 dwarfs. A possible explanation for the relative changes in the z-band may be associated to the disappearance of the strong atomic potassium and sodium bands into molecules (e.g. KCl2 or NaCl) and possibly other alkalis as we move towards cooler temperatures.
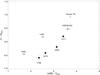 |
Fig. 4 (z − H, Y − H) colour–colour diagram for our targets (filled dots and arrows for lower limits), UGPS J0722227.51 − 054031.2 (open triangle with the error bars; Lucas et al. 2010), and the known T9, CFBDSIR 145829.0 + 101343.0 (open triangle; Delorme et al. 2010). |
The spread in the z − J and z − H colours of Y0 dwarfs is ~ 2.5–3.0 mag, much wider than the spread observed throughout the T dwarf sequence (Fig. 2) and greater than the spread in the J − K colours of L dwarfs (Hawley et al. 2002). This spread can be qualitatively explained using recent models by Morley et al. (2012), which propose that the amount of sulfide clouds present in the atmospheres of these Y dwarfs strongly impacts their spectral energy distributions (note that this is not the case for iron or silicate clouds, which play a role at higher temperatures where the L/T transition takes place). Indeed, Fig. 5 of Morley et al. (2012) shows that the presence of sulfide clouds decreases the emerging flux in the 0.8–1.3 microns with lower effective temperatures (starting off below ~ 900 K). Hence, the clouds affect primarily Y and J but also the z-band, which is what we observe. Moreover, this effect seems to increase with decreasing sedimentation efficiency (the fsed parameter in the models of Marley et al. 2002). Similarly, Fig. 10 of Morley et al. (2012) demonstrates that the combination of a wide range of gravities and presence of sulfide clouds with a variety sedimentation efficiencies increases the spread in the J − H colours of brown dwarfs with temperatures below 600 K. These sulfide clouds may be responsible for the spread observed in the optical-to-infrared colours of Y dwarfs, suggesting that the atmosphere of WISE J0146 may contain thicker clouds and higher gravity than the other Y0 dwarfs in our sample. Table 3 of Leggett et al. (2013) confirms that brown dwarfs with a temperature of 400 K influenced by thicker clouds would be fainter in Y than those affected by thin clouds. As pointed out above, the same effect could occur in the z-band. Moreover, we observe a correlation between the z − H and Y − H colours of the three Y0 dwarfs (Fig. 4) common to our sample and Leggett et al. (2013). The bluer objects in z − H turn out to be also rather blue in Y − H. If this trend holds, we would predict Y − H = 0.96 mag for WISE J0146 + 4234.
Finally, it is important to complete the sample of z-band measurements for Y dwarfs in the southern hemisphere and obtain far-red optical spectroscopy, which is only available for WISE J2056 + 1459 (Leggett et al. 2013). This may show drastic changes as indicated by the z-band photometry, which can probe
changes in the atmospheric properties responsible for the far-red spectral energy distribution of these brown dwarfs. Our photometry would also help the modellers to reproduce this part of the spectral energy distribution, disentangling the effects of clouds, gravity, and pressure-broadened potassium and sodium bands. Thirdly, the relatively blue optical-to-infrared colours of Y0 dwarfs and the possible turnover towards even bluer colours with lower temperatures could have a significant impact on the strategies currently used to identify Y dwarfs in large-scale surveys, such as UKIDSS, CFBDS, Pan-Starrs (Deacon et al. 2011), and large synoptic survey telescope (Abell et al. 2009).
IRAF is distributed by the National Optical Astronomy Observatories, which are operated by the Association of Universities for Research in Astronomy, Inc., under cooperative agreement with the National Science Foundation.
Acknowledgments
N.L. was funded by the Ramón y Cajal fellowship number 08-303-01-02. This research has been supported by the Spanish Ministry of Economics and Competitiveness under the projects AYA2010-19136, AYA2010-21308-C3-02, AYA2010-21308-C03-03 and AYA2010-20535. We are very grateful to the GTC operation team and to Antonio Cabrera-Lavers for his support at all stages of this project. We thank José Alberto Rubiño, Ricardo Genova Santos, Rafael Barrena, and Angela Hempel for obtaining photometric calibration at the Isaac Newton telescope, and Bartek Gauza, María Rosa Zapatero Osorio and Karla Peña Ramírez for their help in obtaining some of the OSIRIS/GTC images. This work is based on observations made with the Gran Telescopio Canarias (GTC), operated on the island of La Palma in the Spanish Observatorio del Roque de los Muchachos of the Instituto de Astrofísica de Canarias. This research has been supported by the Spanish Ministry of Economy and Competitiveness (MINECO) under the grant AYA2010-19136. This research has made use of the Simbad and Vizier databases, operated at the Centre de Données Astronomiques de Strasbourg (CDS), and of NASA’s Astrophysics Data System Bibliographic Services (ADS).
References
- Abell, P. A., Allison, J., Anderson, S. F., LSST Science Collaboration 2009 [arXiv:0912.0201] [Google Scholar]
- Albert, L., Artigau, É., Delorme, P., et al. 2011, AJ, 141, 203 [NASA ADS] [CrossRef] [Google Scholar]
- Burningham, B., Pinfield, D. J., Leggett, S. K., et al. 2009, MNRAS, 395, 1237 [NASA ADS] [CrossRef] [Google Scholar]
- Burningham, B., Leggett, S. K., Lucas, P. W., et al. 2010a, MNRAS, 404, 1952 [NASA ADS] [Google Scholar]
- Burningham, B., Pinfield, D. J., Lucas, P. W., et al. 2010b, MNRAS, 406, 1885 [NASA ADS] [Google Scholar]
- Cepa, J., Aguiar, M., Escalera, V. G., et al. 2000, in SPIE Conf. Ser. 4008, eds. M. Iye, & A. F. Moorwood, 623 [Google Scholar]
- Chiu, K., Fan, X., Leggett, S. K., et al. 2006, AJ, 131, 2722 [NASA ADS] [CrossRef] [Google Scholar]
- Cushing, M. C., Kirkpatrick, J. D., Gelino, C. R., et al. 2011, ApJ, 743, 50 [NASA ADS] [CrossRef] [Google Scholar]
- Cutri, R. M., Skrutskie, M. F., van Dyk, S., et al. 2003, 2MASS All Sky Catalog of point sources, 2246 [Google Scholar]
- Deacon, N. R., Liu, M. C., Magnier, E. A., et al. 2011, AJ, 142, 77 [NASA ADS] [CrossRef] [Google Scholar]
- Delorme, P., Delfosse, X., Albert, L., et al. 2008a, A&A, 482, 961 [NASA ADS] [CrossRef] [EDP Sciences] [Google Scholar]
- Delorme, P., Willott, C. J., Forveille, T., et al. 2008b, A&A, 484, 469 [NASA ADS] [CrossRef] [EDP Sciences] [Google Scholar]
- Delorme, P., Albert, L., Forveille, T., et al. 2010, A&A, 518, A39 [NASA ADS] [CrossRef] [EDP Sciences] [Google Scholar]
- Golimowski, D. A., Leggett, S. K., Marley, M. S., et al. 2004, AJ, 127, 3516 [NASA ADS] [CrossRef] [Google Scholar]
- Hawley, S. L., Covey, K. R., Knapp, G. R., et al. 2002, AJ, 123, 3409 [NASA ADS] [CrossRef] [Google Scholar]
- Kirkpatrick, J. D., Reid, I. N., Liebert, J., et al. 1999, ApJ, 519, 802 [NASA ADS] [CrossRef] [Google Scholar]
- Kirkpatrick, J. D., Gelino, C. R., Cushing, M. C., et al. 2012, ApJ, 753, 156 [NASA ADS] [CrossRef] [Google Scholar]
- Knapp, G. R., Leggett, S. K., Fan, X., et al. 2004, AJ, 127, 3553 [NASA ADS] [CrossRef] [Google Scholar]
- Leggett, S. K., Saumon, D., Marley, M. S., et al. 2012, ApJ, 748, 74 [NASA ADS] [CrossRef] [Google Scholar]
- Leggett, S. K., Morley, C. V., Marley, M. S., et al. 2013, ApJ, in press [arXiv:1212.1210] [Google Scholar]
- Liu, M. C., Delorme, P., Dupuy, T. J., et al. 2011, ApJ, 740, 108 [NASA ADS] [CrossRef] [Google Scholar]
- Liu, M. C., Dupuy, T. J., Bowler, B. P., Leggett, S. K., & Best, W. M. J. 2012, ApJ, 758, 57 [NASA ADS] [CrossRef] [Google Scholar]
- Lodieu, N., Pinfield, D. J., Leggett, S. K., et al. 2007, MNRAS, 379, 1423 [NASA ADS] [CrossRef] [Google Scholar]
- Lucas, P. W., Tinney, C. G., Burningham, B., et al. 2010, MNRAS, L124 [Google Scholar]
- Luhman, K. L., Burgasser, A. J., & Bochanski, J. J. 2011, ApJ, 730, L9 [NASA ADS] [CrossRef] [Google Scholar]
- Marley, M. S., Seager, S., Saumon, D., et al. 2002, ApJ, 568, 335 [NASA ADS] [CrossRef] [Google Scholar]
- Marsh, K. A., Wright, E. L., Kirkpatrick, J. D., et al. 2013, ApJ, 762, 119 [Google Scholar]
- Morgan, W. W., Keenan, P. C., & Kellman, E. 1943, An atlas of stellar spectra, with an outline of spectral classification (The University of Chicago press: Chicago, Ill) [Google Scholar]
- Morley, C. V., Fortney, J. J., Marley, M. S., et al. 2012, ApJ, 756, 172 [NASA ADS] [CrossRef] [Google Scholar]
- Pinfield, D. J., Burningham, B., Tamura, M., et al. 2008, MNRAS, 390, 304 [NASA ADS] [CrossRef] [Google Scholar]
- Reylé, C., Delorme, P., Willott, C. J., et al. 2010, A&A, 522, A112 [NASA ADS] [CrossRef] [EDP Sciences] [Google Scholar]
- Smith, J. A., Tucker, D. L., Kent, S., et al. 2002, AJ, 123, 2121 [Google Scholar]
- Tinney, C. G., Faherty, J. K., Kirkpatrick, J. D., et al. 2012, ApJ, 759, 60 [NASA ADS] [CrossRef] [Google Scholar]
- Tody, D. 1993, in Astronomical Data Analysis Software and Systems II, eds. R. J. Hanisch, R. J. V. Brissenden, & J. Barnes, ASP Conf. Ser., 52, 173 [Google Scholar]
- Wright, E. L., Eisenhardt, P. R. M., Mainzer, A. K., et al. 2010, AJ, 140, 1868 [NASA ADS] [CrossRef] [Google Scholar]
All Tables
GTC/OSIRIS astrometry, photometry (or 3σ lower limits), observing information, and photometry for six Y dwarfs and a T9 + Y0 binary.
All Figures
|
Fig. 1 Finding charts for the six Y dwarfs and the T9 + Y0 binary imaged in Sloan z with GTC/OSIRIS. North is up and east is left. Images are 1 × 1 arcmin. Targets are ordered by increasing right ascension from left to right starting from the top left corner. The open circles have a radius of five arcsec and mark the WISE position of the Y dwarfs, showing the motion of the object when detected (small red circle with two arcsec radius). |
| In the text | |
|
Fig. 2 z − J (left) and z − H (right) colours of Y0 dwarfs (filled dots for detections and arrows for lower limits) as a function of spectral type compared to the colours of late-T dwarfs from UKIDSS (diamonds; Burningham et al. 2010b), Sloan (asterisks; Golimowski et al. 2004; Knapp et al. 2004; Chiu et al. 2006), Canada-France brown dwarf survey (squares; Albert et al. 2011), and the sample of Leggett et al. (2013, triangles). |
| In the text | |
|
Fig. 3 (z − H, H − w2) colour–colour diagram for our targets (filled dots and arrows for lower limits), late-T dwarfs (open triangles; Leggett et al. 2013), and UGPS J0722227.51 − 054031.2 (open triangle with error bars; Lucas et al. 2010). |
| In the text | |
|
Fig. 4 (z − H, Y − H) colour–colour diagram for our targets (filled dots and arrows for lower limits), UGPS J0722227.51 − 054031.2 (open triangle with the error bars; Lucas et al. 2010), and the known T9, CFBDSIR 145829.0 + 101343.0 (open triangle; Delorme et al. 2010). |
| In the text | |
Current usage metrics show cumulative count of Article Views (full-text article views including HTML views, PDF and ePub downloads, according to the available data) and Abstracts Views on Vision4Press platform.
Data correspond to usage on the plateform after 2015. The current usage metrics is available 48-96 hours after online publication and is updated daily on week days.
Initial download of the metrics may take a while.