Fig. 6
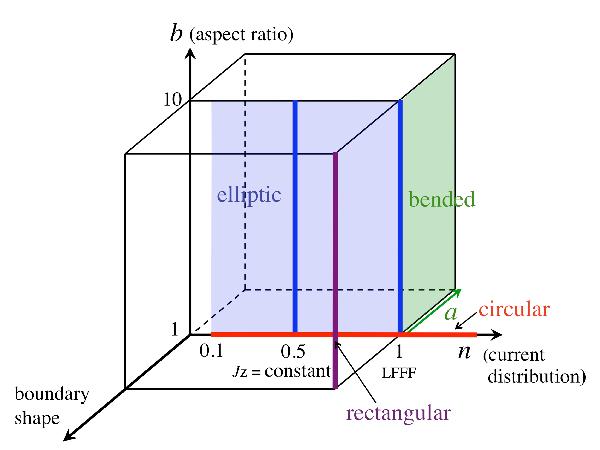
Drawing defining the regions of the parameter space explored. The red line indicates the circular models analyzed in Sect. 3. The MC boundary is elliptical for the blue region and is deformed to a bean shape in the green region. The two blue lines indicate the elliptical models analyzed in Sect. 4. Finally, the purple line indicates an extreme case where the MC boundary is rectangular. n defines the axial electric current and magnetic field component (Eqs. (3), (4)). A cross section elongated orthogonally to the spacecraft trajectory has b > 1 (Fig. 2).
Current usage metrics show cumulative count of Article Views (full-text article views including HTML views, PDF and ePub downloads, according to the available data) and Abstracts Views on Vision4Press platform.
Data correspond to usage on the plateform after 2015. The current usage metrics is available 48-96 hours after online publication and is updated daily on week days.
Initial download of the metrics may take a while.