Fig. 15
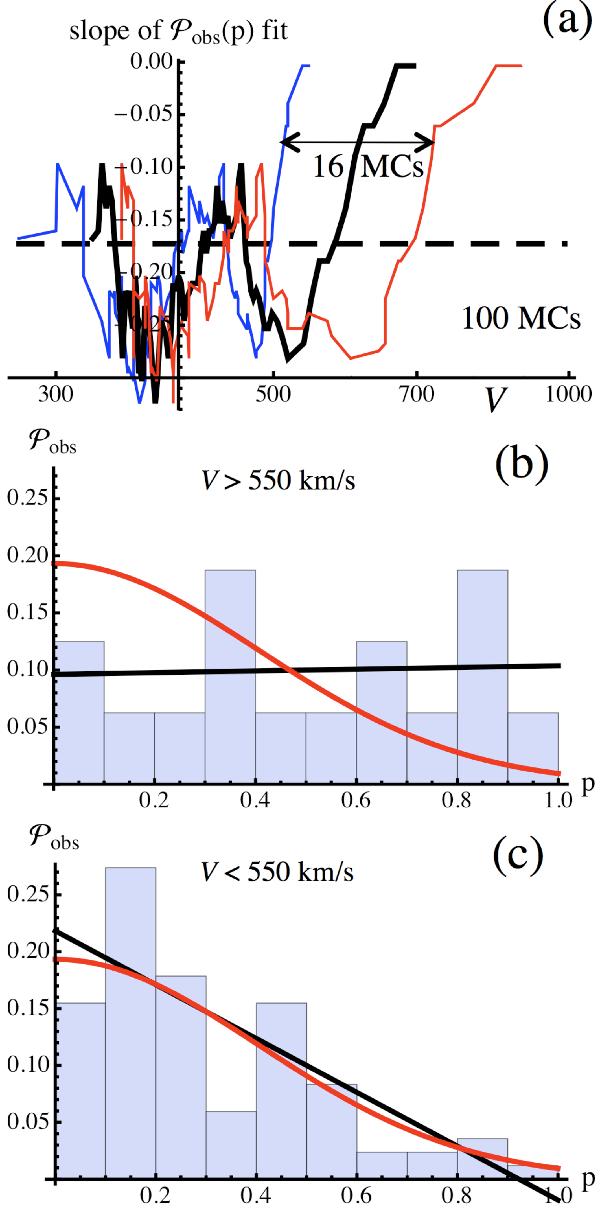
Properties of impact parameter distributions  for different MC groups. a) Slope of the linear fit of when MCs are first ordered with a growing mean velocity V, then binned in groups of 16 cases (running grouping with increasing V). The three curves represent this slope, with the black line corresponding to the mean V of each group and the blue (resp. red) line corresponding to the minimum (resp. maximum) value of each group. The horizontal dashed line is the slope for all MCs (slope of the black line in Fig. 1). The horizontal axis is scaled with the logarithm of V. b), c) Probability distribution, , as in Fig. 1, with MCs separated in two groups according to their mean velocity V.
Current usage metrics show cumulative count of Article Views (full-text article views including HTML views, PDF and ePub downloads, according to the available data) and Abstracts Views on Vision4Press platform.
Data correspond to usage on the plateform after 2015. The current usage metrics is available 48-96 hours after online publication and is updated daily on week days.
Initial download of the metrics may take a while.