Fig. 1
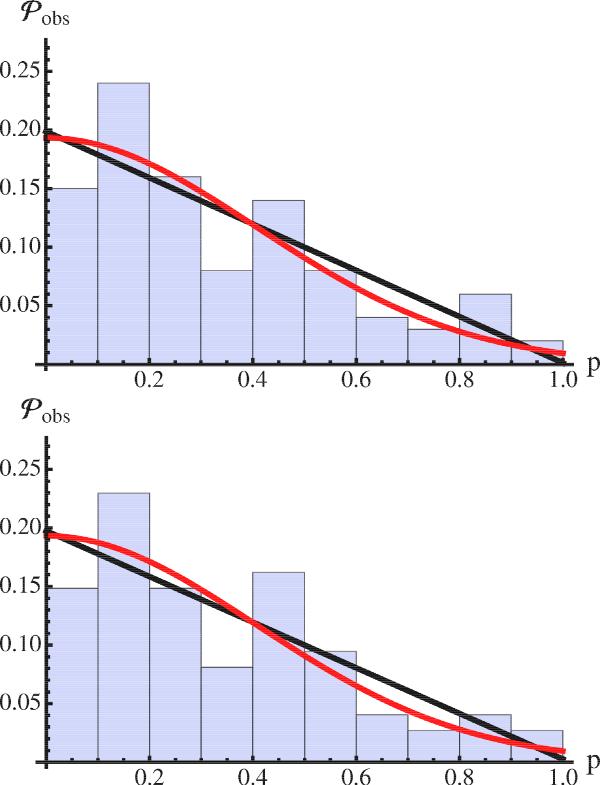
Probability distribution,  , of the impact parameter (p). The results of MCs observed by WIND at 1 AU and fitted by the Lundquist model (Lepping & Wu 2010; Lepping et al. 1990) are shown with a histogram having 10 bins of p. Black curve: a linear fit to the histogram. Red curve: the Gaussian function derived by Lepping & Wu (2010). The histogram in the top panel has 100 MCs, while the one in the bottom panel is restricted to the 74 best observed MCs (quality 1, 2).
Current usage metrics show cumulative count of Article Views (full-text article views including HTML views, PDF and ePub downloads, according to the available data) and Abstracts Views on Vision4Press platform.
Data correspond to usage on the plateform after 2015. The current usage metrics is available 48-96 hours after online publication and is updated daily on week days.
Initial download of the metrics may take a while.