Fig. 2
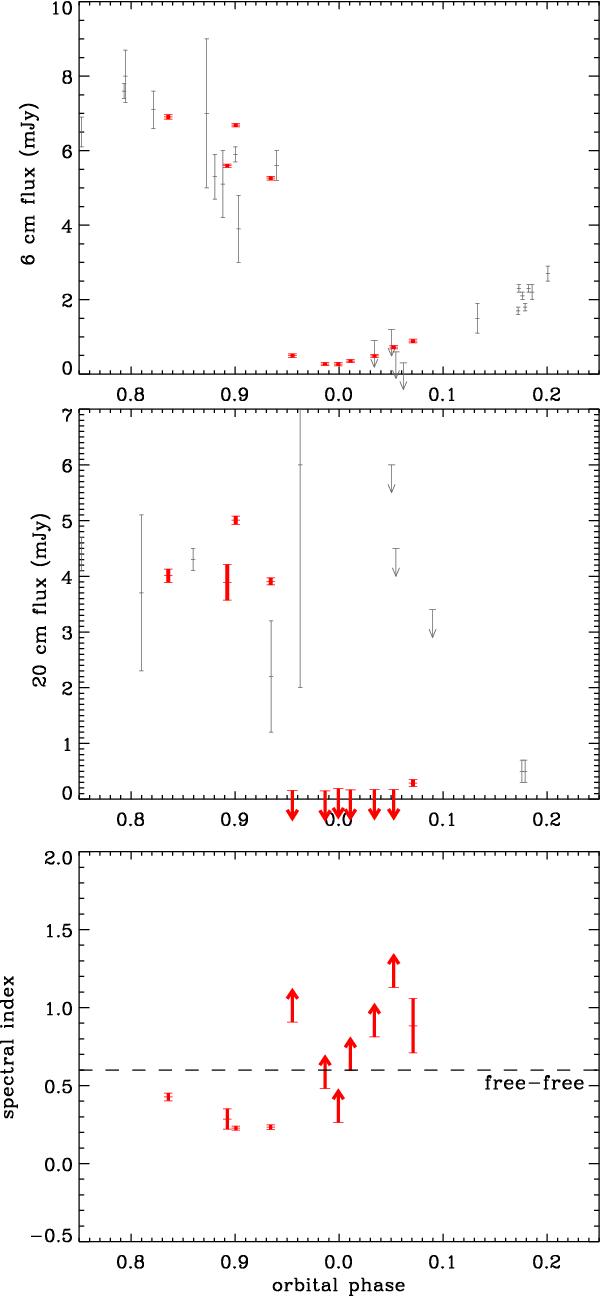
Radio fluxes and spectral indexes around the periastron passage of Cyg OB2 #9, as a function of orbital phase. The top figure shows the 6 cm flux, the middle one the 20 cm flux, and the bottom one the spectral index. The older VLA data from van Loo et al. (2008) are plotted with a grey line. The new EVLA data are shown with the thicker solid red line. The length of the line indicates the 1σ error bar on the flux. For the non-detections, upper limits are shown that are 3 × the rms noise in the centre of the image. The fluxes have an additional uncertainty of ~5% due to the absolute flux calibration (not shown on the figure). On the spectral index figure, the dashed line indicates the value for free-free emission (α = + 0.6). Periastron occurs at phase = 0.0.
Current usage metrics show cumulative count of Article Views (full-text article views including HTML views, PDF and ePub downloads, according to the available data) and Abstracts Views on Vision4Press platform.
Data correspond to usage on the plateform after 2015. The current usage metrics is available 48-96 hours after online publication and is updated daily on week days.
Initial download of the metrics may take a while.