Fig. 6
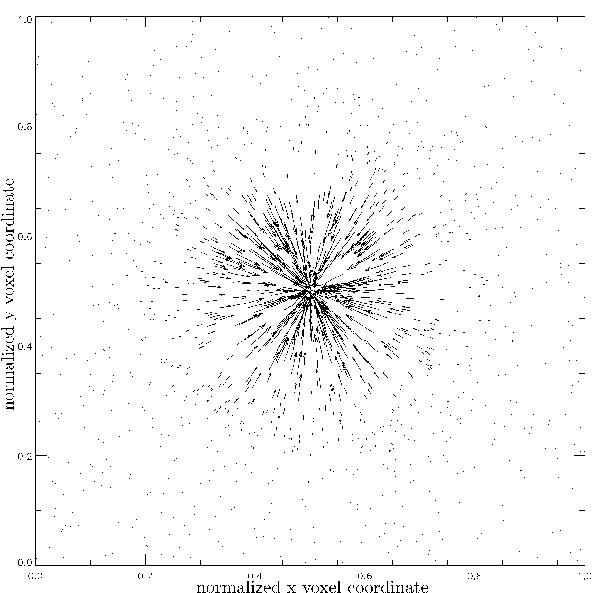
Illustration of horizontal energy flow for the bottom region z = 10 of the spot model at CO line wavelength λ = λline. The graphic shows the flow lines of x and y components of the flux vector F. The length of an arrow is proportional to the field vector magnitude ∥ (Fx,Fy) ∥ following the direction of (Fx,Fy), the field vectors shown have been selected randomly. The 3D radiative transport equation is solved for nϑ = nφ = 64 solid angle points. The normalized x and y coordinates are shown on the x and y axes, respectively.
Current usage metrics show cumulative count of Article Views (full-text article views including HTML views, PDF and ePub downloads, according to the available data) and Abstracts Views on Vision4Press platform.
Data correspond to usage on the plateform after 2015. The current usage metrics is available 48-96 hours after online publication and is updated daily on week days.
Initial download of the metrics may take a while.