Fig. 4
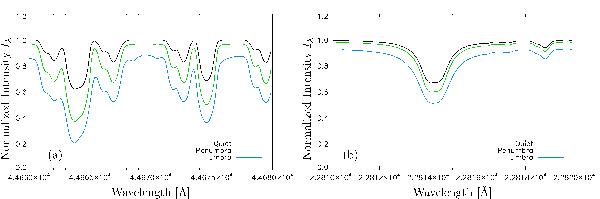
Intensity spectrum for a surface resolved starspot and μ = 1.0. Shown is the umbra (blue), represented by the spectrum for the central voxel of the spots surface, the penumbra (green), represented by a voxel at half of the spots radius from the center of the grid and the undisturbed surface (black), represented by a voxel at the far rim of the grid. The left panel shows several lines of a CO band spectrum, while the right panel shows a wavelength region including a Mg I doublet line.
Current usage metrics show cumulative count of Article Views (full-text article views including HTML views, PDF and ePub downloads, according to the available data) and Abstracts Views on Vision4Press platform.
Data correspond to usage on the plateform after 2015. The current usage metrics is available 48-96 hours after online publication and is updated daily on week days.
Initial download of the metrics may take a while.