Fig. 1
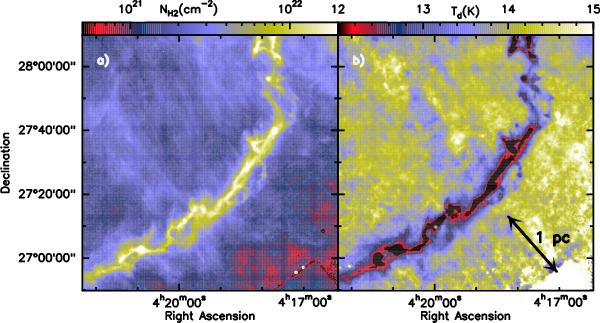
a) High-resolution (18.2′′) column density map of the Taurus B211/B213 region (in units of NH2 cm-2) derived from Herschel data as explained in Appendix A. b) Dust temperature map of the Taurus B211/B213 region (in K) derived at 36.3′′ from Herschel data. Comparison of the two panels shows how dust temperature and column density are anti-correlated.
Current usage metrics show cumulative count of Article Views (full-text article views including HTML views, PDF and ePub downloads, according to the available data) and Abstracts Views on Vision4Press platform.
Data correspond to usage on the plateform after 2015. The current usage metrics is available 48-96 hours after online publication and is updated daily on week days.
Initial download of the metrics may take a while.