Fig. 4
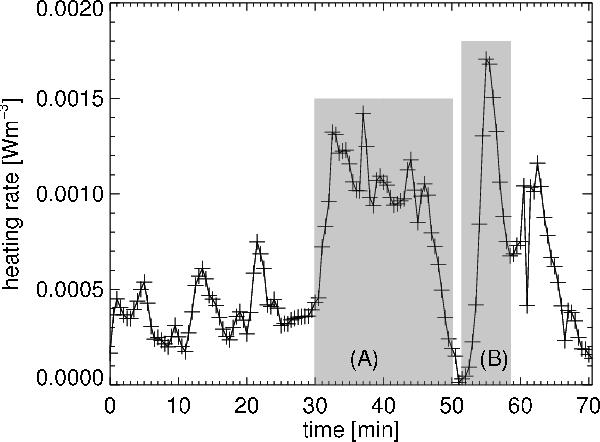
Ohmic heating rate (~j2) at a fixed point in space for more than a solar hour. The data points are marked by crosses. Here a gridpoint at the very base of the corona and transition region (≈3 Mm height) was chosen which is representative of the region where the heating rate per particle is maximal. The large cross in Fig. 2 indicates the horizontal location. The shaded regions (A) and (B) indicate a nanoflare storm and a single nanoflare, see Sect. 3.
Current usage metrics show cumulative count of Article Views (full-text article views including HTML views, PDF and ePub downloads, according to the available data) and Abstracts Views on Vision4Press platform.
Data correspond to usage on the plateform after 2015. The current usage metrics is available 48-96 hours after online publication and is updated daily on week days.
Initial download of the metrics may take a while.