Fig. 2
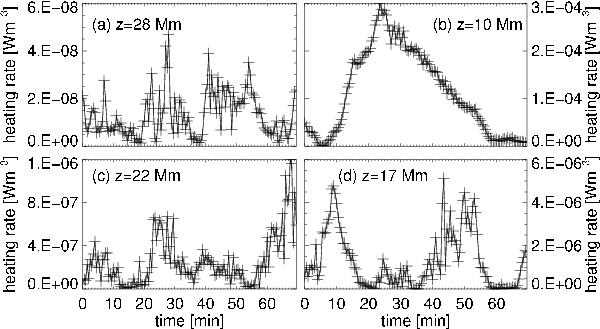
Temporal evolution of the Ohmic heating rate (~j2) at four different locations (single grid-points) in the model corona: a) grid-point with smallest time-averaged heat input, and b) with strongest time-averaged heat input in the coronal volume at T > 105 K; c) location at the top of a bright loop seen in the synthesized coronal emission; and d) at the coronal base at the footpoint of the bright loop. The crosses mark the times of the snapshots. The geometrical heights of these four locations are indicated in Fig. 3. The locations are also indicated in Fig. 1 relative to the photospheric magnetic field.
Current usage metrics show cumulative count of Article Views (full-text article views including HTML views, PDF and ePub downloads, according to the available data) and Abstracts Views on Vision4Press platform.
Data correspond to usage on the plateform after 2015. The current usage metrics is available 48-96 hours after online publication and is updated daily on week days.
Initial download of the metrics may take a while.