Fig. 5
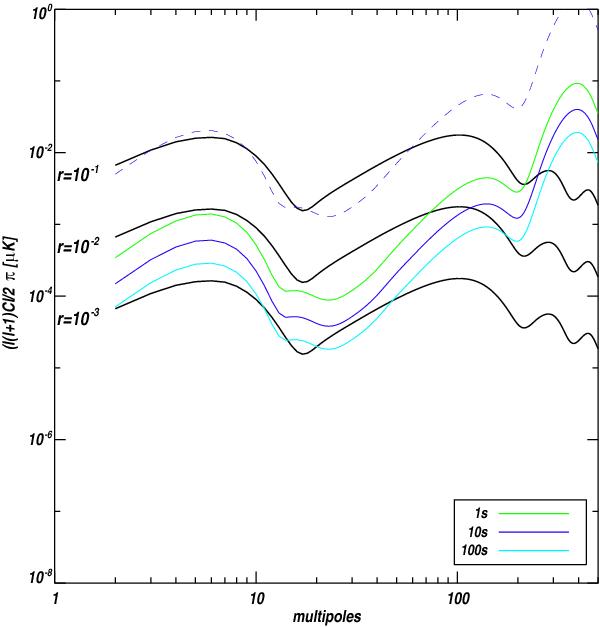
ΔCl due to leakage from E-mode for different times on measurements per baseline tb = 1 s, 10 s and, 100 s for the QUBIC instrument. The colored solid lines represent the leakage after applying the self-calibration method for different measuring times per baseline. The dashed line represents the error on the B-mode power spectrum without self-calibration method. The black lines are the primordial B-mode spectrums for r = 10-1, r = 10-2, and r = 10-3.
Current usage metrics show cumulative count of Article Views (full-text article views including HTML views, PDF and ePub downloads, according to the available data) and Abstracts Views on Vision4Press platform.
Data correspond to usage on the plateform after 2015. The current usage metrics is available 48-96 hours after online publication and is updated daily on week days.
Initial download of the metrics may take a while.