Fig. 7
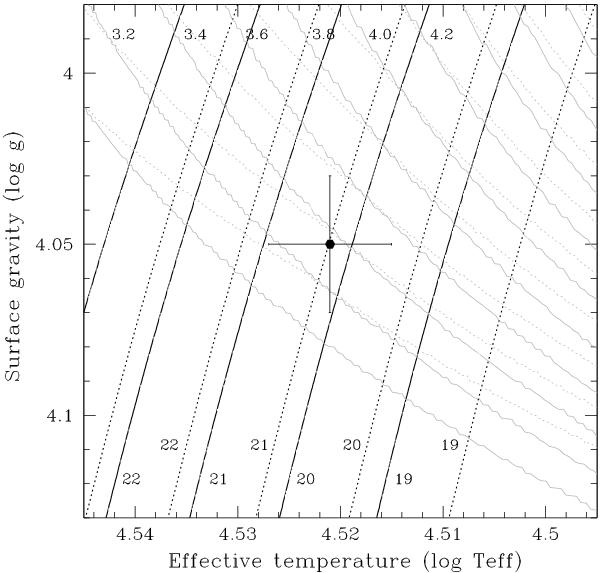
Location of the primary component of HD 165246 in Teff vs. log g plane. Evolutionary tracks for models are labelled by their mass in the solar units. Evolutionary models by Brott et al. (2011) for the initial rotational velocities of v = 0 and 270 km s-1 are plotted as solid and dotted lines, respectively. Isochrones are plotted as solid and dotted thin lines.
Current usage metrics show cumulative count of Article Views (full-text article views including HTML views, PDF and ePub downloads, according to the available data) and Abstracts Views on Vision4Press platform.
Data correspond to usage on the plateform after 2015. The current usage metrics is available 48-96 hours after online publication and is updated daily on week days.
Initial download of the metrics may take a while.