Fig. 4
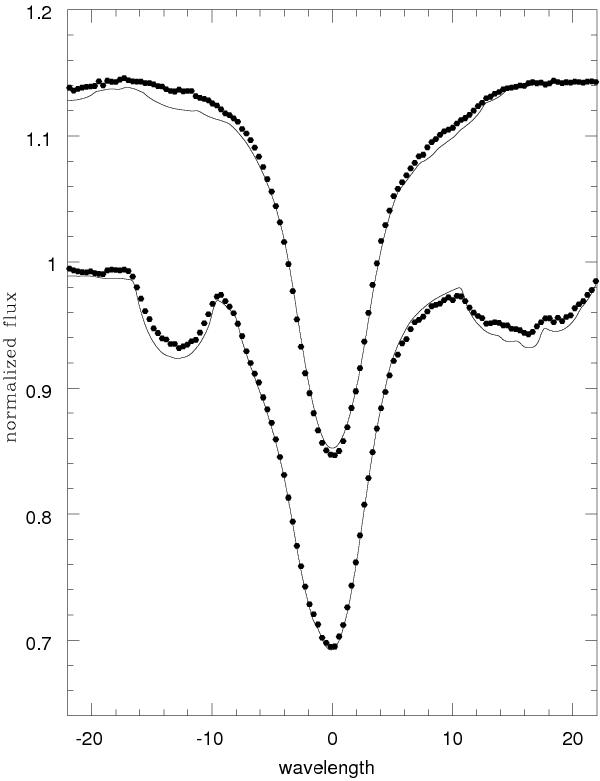
A comparison of the disentangled and fitted line profiles of the Hγ (top) and Hδ (bottom) Balmer lines of the primary. Renormalised disentangled spectra are shown by black dots, while the best-fitting synthetic line profiles derived via optimisation in the OSTAR grid of non-LTE spectra calculated by Lanz & Hubeny (2003) are shown as solid lines. Blends conspicuous on hydrogen line profiles due to the various metals are not fitted. Theoretical spectra calculated for the solar abundance were used.
Current usage metrics show cumulative count of Article Views (full-text article views including HTML views, PDF and ePub downloads, according to the available data) and Abstracts Views on Vision4Press platform.
Data correspond to usage on the plateform after 2015. The current usage metrics is available 48-96 hours after online publication and is updated daily on week days.
Initial download of the metrics may take a while.