Fig. 2
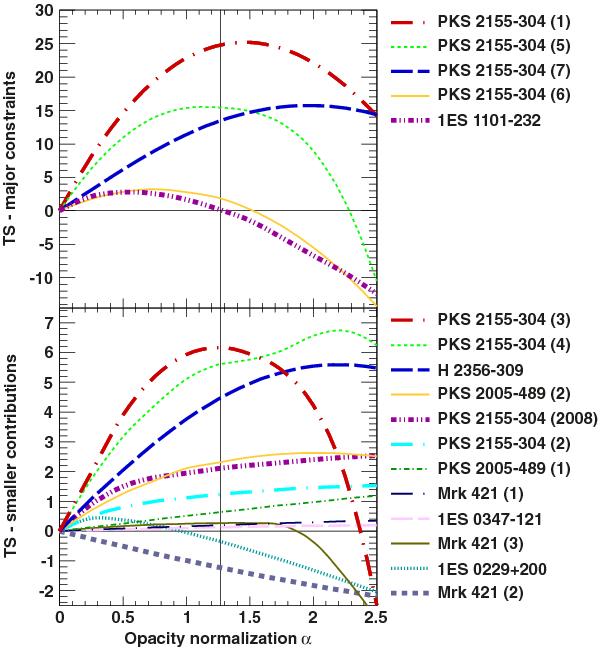
Test statistic as a function of the normalized EBL optical depth for the intrinsic spectral models described in Table 3. The TS profiles are sorted by contribution to the measurement and the top panel shows the most constraining data sets, while the bottom panel shows the less constraining contributions. The vertical line indicates the best fit value derived in this study. Note the different scale on the vertical axis in the upper and the lower panel.
Current usage metrics show cumulative count of Article Views (full-text article views including HTML views, PDF and ePub downloads, according to the available data) and Abstracts Views on Vision4Press platform.
Data correspond to usage on the plateform after 2015. The current usage metrics is available 48-96 hours after online publication and is updated daily on week days.
Initial download of the metrics may take a while.