Fig. 2
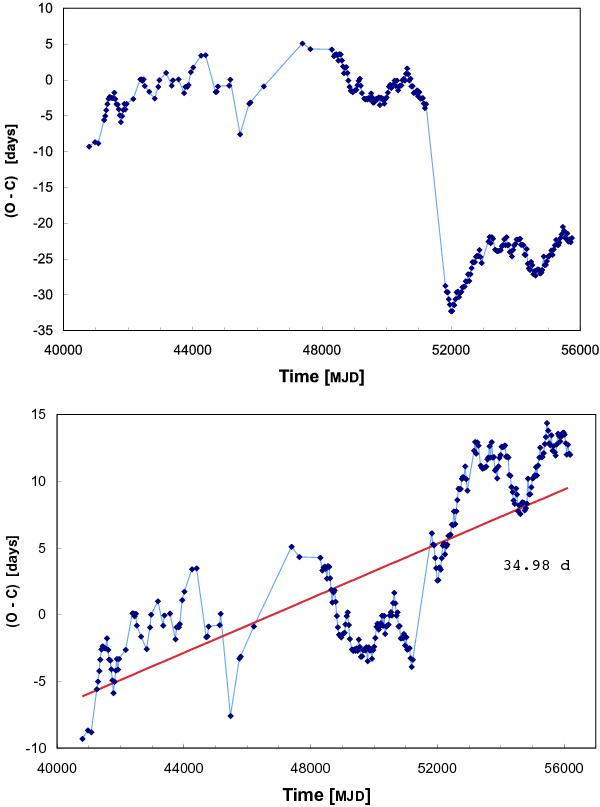
Turn-on history of Her X-1: the (O–C) diagram (using 20.5 × Porb as the period to calculate the expected turn-ons). Upper: the anomalous low around MJD 51 500 (AL3) is assumed to last for eighteen 35 d cycles. Lower: the same assuming that there were only seventeen 35 d cycles (see Staubert et al. 2009). The solid line represents the linear best fit to all data, defining a mean period of 34.98 d (which may be used for a rough ephemeris of turn-ons).
Current usage metrics show cumulative count of Article Views (full-text article views including HTML views, PDF and ePub downloads, according to the available data) and Abstracts Views on Vision4Press platform.
Data correspond to usage on the plateform after 2015. The current usage metrics is available 48-96 hours after online publication and is updated daily on week days.
Initial download of the metrics may take a while.