Free Access
Fig. 1
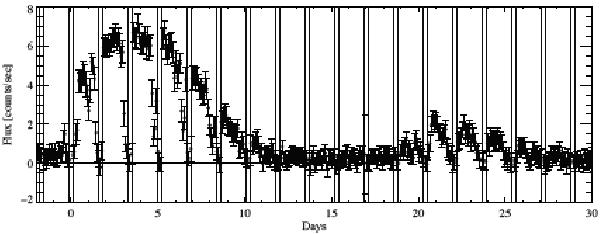
Average 35 d flux profile of Her X-1, generated by accumulating light curves observed by RXTE/ASM for 35 d turn-ons around binary phase 0.2 (Fig. 3 of Klochkov et al. 2006). The vertical lines indicate the binary eclipses.
Current usage metrics show cumulative count of Article Views (full-text article views including HTML views, PDF and ePub downloads, according to the available data) and Abstracts Views on Vision4Press platform.
Data correspond to usage on the plateform after 2015. The current usage metrics is available 48-96 hours after online publication and is updated daily on week days.
Initial download of the metrics may take a while.