Fig. 9
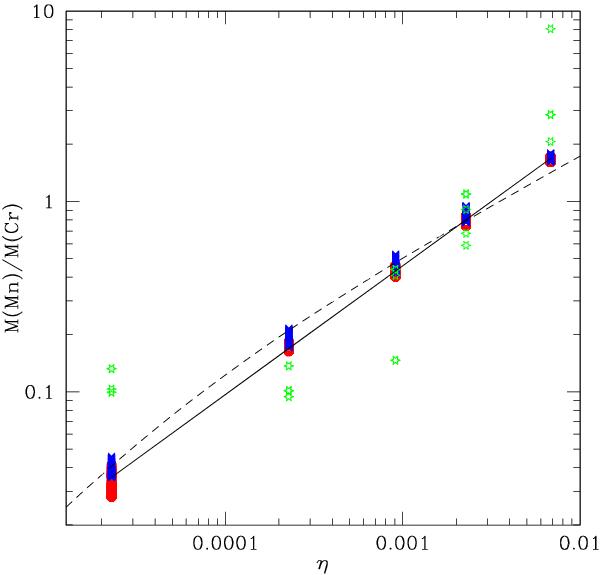
Averaged final mass fraction ratio Mn/Cr as a function of the initial neutron excess. The average mass fractions are drawn either from the fit to the distribution of maximum temperatures given in the left panel of Fig. 3 (red circles) or from a uniform distribution function representative of the models shown in the right panel of the same figure (blue crosses). In both cases, the results are shown for different τrise in the range 10-9−0.2 s, τ in the range 0.10−0.90 s, and X(12C) in the range 0.3−0.7. The solid line is a fit given by, M(Mn)/M(Cr) = 49.1η0.676. The dashed line shows the relationship expected from an analytic model, Eq. (17). Green stars give the mass fraction ratio Mn/Cr for high-entropy conditions (see text for details).
Current usage metrics show cumulative count of Article Views (full-text article views including HTML views, PDF and ePub downloads, according to the available data) and Abstracts Views on Vision4Press platform.
Data correspond to usage on the plateform after 2015. The current usage metrics is available 48-96 hours after online publication and is updated daily on week days.
Initial download of the metrics may take a while.