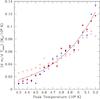
Fig. 3
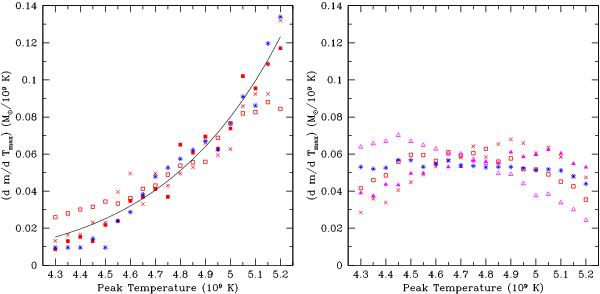
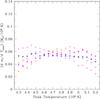
Distribution of maximal temperatures in the incomplete Si-burning region obtained from a suite of SNIa models. Left: one-dimensional delayed detonation models DDTc (red crosses, Badenes et al. 2005) and DDTf (red solid squares), a sub-Chandrasekhar model (blue stars) from Bravo et al. (2011, fourth row in their Table 2), and three-dimensional delayed detonation model TURB7 from Bravo et al. (2009, red empty squares,). The solid line is a fit to the data given by,  . Right: three-dimensional delayed detonation models DDT3DA (red empty squares) and DDT3DB (red crosses) from Bravo & García-Senz (2008), gravitationally confined detonation model GCD1 (magenta solid triangles), pulsating reverse detonation model PRD18 (magenta empty triangles), both from Bravo et al. (2009), and sub-Chandrasekhar model C (blue stars) from García-Senz et al. (1999). The distribution of maximal temperatures in these models is approximately constant, independent of the peak temperature, unlike the models shown in the left panel.
Current usage metrics show cumulative count of Article Views (full-text article views including HTML views, PDF and ePub downloads, according to the available data) and Abstracts Views on Vision4Press platform.
Data correspond to usage on the plateform after 2015. The current usage metrics is available 48-96 hours after online publication and is updated daily on week days.
Initial download of the metrics may take a while.