Fig. 15
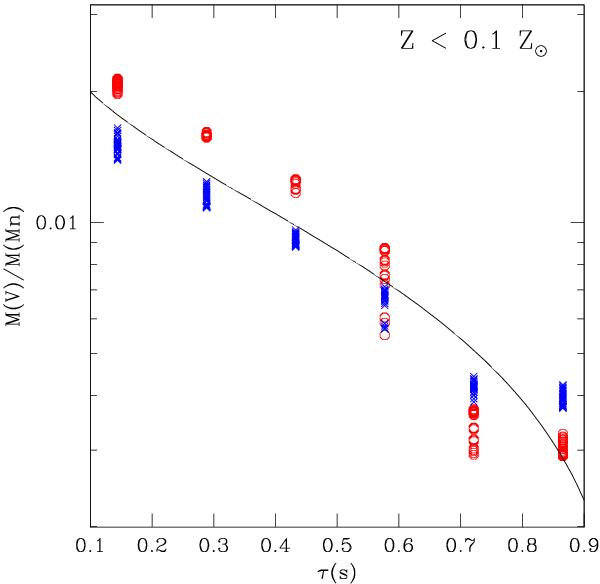
Averaged final mass fraction ratio of vanadium to manganese as tracer of the expansion timescale, at fixed neutron excess, η = 2.27 × 10⁻⁵. The meaning of the point types and colors is the same as in Fig. 9. The results are shown for different τrise in the range 10-9−0.2 s, and X(12C) in the range 0.3−0.7. The solid line is a fit given by M(V)/M(Mn) = log [log (1/τ)0.7] −1.7.
Current usage metrics show cumulative count of Article Views (full-text article views including HTML views, PDF and ePub downloads, according to the available data) and Abstracts Views on Vision4Press platform.
Data correspond to usage on the plateform after 2015. The current usage metrics is available 48-96 hours after online publication and is updated daily on week days.
Initial download of the metrics may take a while.