Fig. 14
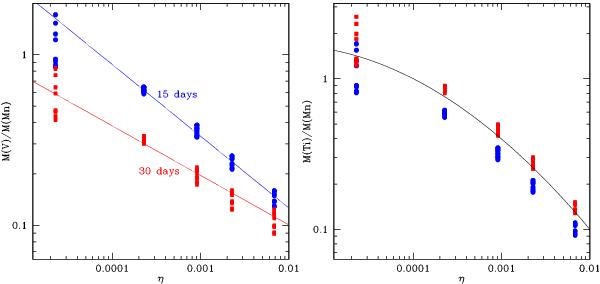
Averaged final mass fraction ratios V/Mn and Ti/Mn in the optical phase, as a function of the initial neutron excess. The point types and colors in these plots refer to the time at which the ratios are drawn, blue solid circles are calculated at day 15, whereas red solid squares belong to day 30. The ranges of the parameters τrise, τ, and X(12C) are as in Fig. 9. Left: abundance ratio of vanadium to manganese. The ratios are fit by power-law functions, namely M(V)/M(Mn) = 0.018/η0.42 for the points at day 15, and M(V)/M(Mn) = 0.026/η0.29 for the points at day 30. Right: abundance ratio of titanium to manganese. In this case, the points belonging to days 15 and 30 can be reasonably fit by a single function, although it cannot be a simple power law. The fit function shown is, M(Ti)/M(Mn) = exp(−6.45−1.1lnη−0.043ln2η).
Current usage metrics show cumulative count of Article Views (full-text article views including HTML views, PDF and ePub downloads, according to the available data) and Abstracts Views on Vision4Press platform.
Data correspond to usage on the plateform after 2015. The current usage metrics is available 48-96 hours after online publication and is updated daily on week days.
Initial download of the metrics may take a while.