Fig. 12
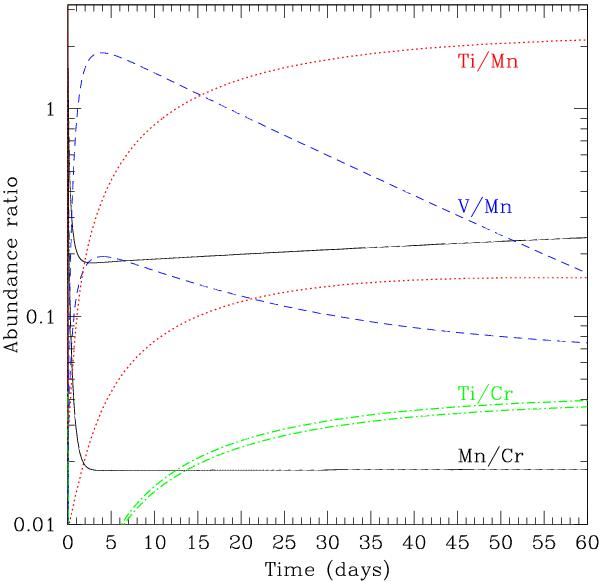
Evolution with time of the abundance ratios of potential tracers of the progenitor metallicity in the optical epoch: solid black lines belong to Mn/Cr, dashed blue lines to V/Mn, and dotted red lines to Ti/Mn. For each couple of elements, the labeled curve is the one belonging to X(22Ne) = 2.5 × 10⁻⁴, whereas the other curve with the same type and color belongs to X(22Ne) = 0.075. The dot-dashed green line shows the evolution of Ti/Cr ratio, which could be used as a control variable, see Sect. 7.
Current usage metrics show cumulative count of Article Views (full-text article views including HTML views, PDF and ePub downloads, according to the available data) and Abstracts Views on Vision4Press platform.
Data correspond to usage on the plateform after 2015. The current usage metrics is available 48-96 hours after online publication and is updated daily on week days.
Initial download of the metrics may take a while.