Fig. 11
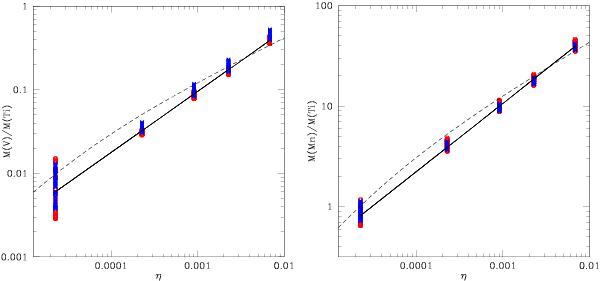
Averaged final mass fraction ratios of vanadium to titanium and of manganese to titanium as tracers of the initial neutron excess. The meaning of the point types and colors, as well as the ranges of parameters are the same as in Fig. 9. Left: mass ratio V/Ti. The solid line is a fit given by, M(V)/M(Ti) = 14.8η0.73. The dashed line shows the relationship expected from an analytic model, Eq. (19). Right: mass ratio Mn/Ti. The solid line is a fit given by, M(Mn)/M(Ti) = 1170η0.68. The dashed line shows the relationship expected from an analytic model, Eq. (21).
Current usage metrics show cumulative count of Article Views (full-text article views including HTML views, PDF and ePub downloads, according to the available data) and Abstracts Views on Vision4Press platform.
Data correspond to usage on the plateform after 2015. The current usage metrics is available 48-96 hours after online publication and is updated daily on week days.
Initial download of the metrics may take a while.