Free Access
Fig. 2
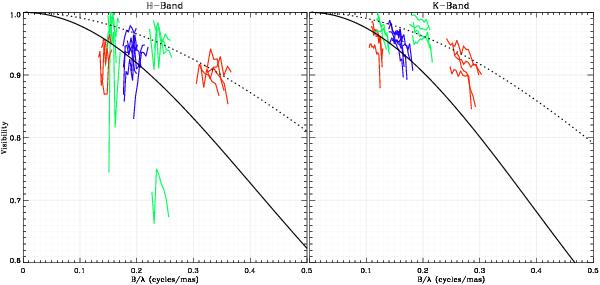
Left: H band data from the VLTI/AMBER instrument for different baselines (blue, red and green lines) with a LITpro model over-ploted along the minor (dotted line) and major (plain line) disk axis. Right: same kind of data but for the K band.
Current usage metrics show cumulative count of Article Views (full-text article views including HTML views, PDF and ePub downloads, according to the available data) and Abstracts Views on Vision4Press platform.
Data correspond to usage on the plateform after 2015. The current usage metrics is available 48-96 hours after online publication and is updated daily on week days.
Initial download of the metrics may take a while.