| Issue |
A&A
Volume 550, February 2013
|
|
|---|---|---|
| Article Number | A33 | |
| Number of page(s) | 4 | |
| Section | Interstellar and circumstellar matter | |
| DOI | https://doi.org/10.1051/0004-6361/201220297 | |
| Published online | 22 January 2013 | |
Research Note
Supernova remnant G296.7–0.9 in X-rays
1
Max Planck Institute for extraterrestrial Physics,
Giessenbachstrasse,
85741
Garching,
Germany
e-mail: This email address is being protected from spambots. You need JavaScript enabled to view it.
2
Max-Planck Institut für Radioastronomie,
Auf dem Hügel 69,
53121
Bonn,
Germany
Received:
28
August
2012
Accepted:
10
December
2012
Abstract
Aims. We present a detailed study of the supernova remnant G296.7–0.9 in the 0.2–12 keV X-ray band.
Methods. Using data from XMM-Newton, we performed a spectro-imaging analysis of G296.7–0.9 in order to deduce the basic parameters of the remnant and search for evidence of a young neutron star associated with it.
Results. In X-rays the remnant is characterized by a bright arc located in the south-west direction. Its X-ray spectrum can be best described by an absorbed non-equilibrium collisional plasma model with a column density of NH = 1.24-0.05+0.07 × 1022 cm-2 and a plasma temperature of 6.2-0.8+0.9 million Kelvin. The analysis indicates a remnant age of 5800 to 7600 years and a distance of 9.8-0.7+1.1 kpc. The latter suggests a spatial connection with a close-by HII region. We did not find evidence for the existence of a young neutron star associated with the remnant.
Key words: ISM: supernova remnants / ISM: individual objects: G296.7-0.9 / stars: neutron
© ESO, 2013
1. Introduction
Every year, several hundred supernova (SN) events are observed, representing the end state of stellar evolution in which a core-collapse of a massive star or the thermonuclear disruption of a white dwarf takes place. SNe are the most energetic events that can be observed in the universe. They are often as bright as a whole galaxy, and their extreme brightness allows them to be seen up to distances of Gpc (Rodney et al. 2011). On this scale, though, the only information obtainable from them is the characteristic rising and fading of their light as a function of time, i.e., their photometric light curve, and their spectral evolution, both of which are important for their classification (Sako et al. 2008). Most of these events are discovered in the optical band by comparing observations taken at different epochs.
In our own Galaxy, the rate of observed SNe is small. For core-collapse SNe, it averages
only about two per century. This estimate is suggested by the γ-ray
radiation from  Al in the Galaxy
(Diehl et al. 2006), in which a certain yield is
expected to be formed in each core-collapse SN. Many SNe, though, remain unobserved due to
optical light extinction. The last recorded SN in our Galaxy, the Kepler SN, was observed in
AD 1604, and only six other SNe have been detected in the Galaxy in the past two thousand
years (Green & Stephenson 2003). The optical
light from the two youngest Galactic SNe, G1.9+0.3 and Cas A, was not observed about 100 and
350 years ago, respectively (Reynolds et al. 2008;
Green & Stephenson 2003).
Al in the Galaxy
(Diehl et al. 2006), in which a certain yield is
expected to be formed in each core-collapse SN. Many SNe, though, remain unobserved due to
optical light extinction. The last recorded SN in our Galaxy, the Kepler SN, was observed in
AD 1604, and only six other SNe have been detected in the Galaxy in the past two thousand
years (Green & Stephenson 2003). The optical
light from the two youngest Galactic SNe, G1.9+0.3 and Cas A, was not observed about 100 and
350 years ago, respectively (Reynolds et al. 2008;
Green & Stephenson 2003).
If there is no direct light from an SN observed, then we at least have the opportunity to study the light of the remnants of several nearby SNe because the light of these supernova remnants (SNRs) remain visible in various spectral bands for up to 105 years. Although the light echo from the SN Cas A was found recently (Rest et al. 2008), it is one of the few cases so far where the SN light could be studied a few hundred years after the SN. Thus, the most promising way to learn about the evolution of an SN shock front and the feedback on the evolution of their host galaxy is to study the diffuse emission of SNRs.
In the last few years, several new SNRs have been detected thanks to the increasing sensitivity of modern X-ray observatories. One of those remnants is G296.7–0.9, which was first detected in X-rays by Schaudel et al. (2002) and later identified to be an SNR by Schaudel (2003) and Robbins et al. (2012). It is a shell-like SNR in which X-ray and radio emissions have been detected. In addition, filaments in the infrared and Hα band were detected in near the source (Robbins et al. 2012). Whether they are associated with the remnant still remains to be shown.
A first detailed study of the SNR G296.7–0.9 was presented by Robbins et al. (2012) using ROSAT PSPC data. As this detector had roughly five independent energy channels in the range 0.1–2 keV, the spectral results of their analysis were very limited. They suggested that the X-rays were emitted from a thermal plasma. Robbins et al. (2012) were therefore not able to put any constraints with high confidence on the derived spectral parameters. The ROSAT data did not allow them to deduce parameters such as the age or the expansion velocity of the remnant.
In this work we report on an XMM-Newton observation that was targeted on SNR G296.7–0.9. The results of the spatial and spectral analysis of this data are presented in Sect. 2. In the discussion in Sect. 3, we use the inferred spectral parameters of G296.7–0.9 to derive an estimate for its age, radius, expansion velocity, and distance. Section 4 provides the concluding summary.
2. X-ray observation and data reduction
G296.7–0.9 was observed for 13.6 ks on 28 June 2011 with EPIC cameras (Strüder et al. 2001) on board the X-ray observatory XMM-Newton (ObsID 0675070101). The two MOS and the PN cameras were operated in full-frame mode using the medium filter. Part of the observation was taken with the filter wheel in closed position because the observation was strongly affected by particle background radiation. Therefore, the performed duration was only 4.4 ks and 5.5 ks for the PN and MOS1/2 detectors, respectively.
We used the XMM SAS version 11.0.0 to reprocess and reduce the data. Times of high background activity were identified by inspecting the light curves of the MOS1/2 and PN data at energies above 10 keV. After removing these times, the effective exposures of the PN, MOS1, and MOS2 cameras were 3.7 ks, 5.1 ks, and 5.3 ks, respectively. We extracted images and exposure maps in the five standard bands of XMM-Newton using all EPIC instruments. Single and double events were selected from the PN data and single to quadruple events from the MOS data sets.
For the spectral fitting, we used the X-Ray Spectral Fitting Package (XSPEC) version 12.7.0u. and restricted the energy range to 0.4–6.0 keV because the count rate detected at higher energies was too sparse for a meaningful spectral analysis. Below 0.4 keV, the detector and telescope response is not well established. All given uncertainties represent the 1σ confidence range for one parameter of interest, unless stated otherwise.
2.1. Spatial analysis
Figure 1 shows the X-ray color image of SNR
G296.7–0.9. A bright arc that appears to lie along an elliptical shell is clearly detected
in the south-east. Its center is at RA ,
Decc = −63°06′29″ ± 3″ with a semimajor axis of 5′ and a semiminor axis of
,
Decc = −63°06′29″ ± 3″ with a semimajor axis of 5′ and a semiminor axis of
 .
.
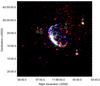 |
Fig. 1 30′ × 30′ XMM-Newton MOS1/2 color image of G296.7–0.9 (red 0.5–0.9 keV, green 0.9–1.3 keV, and blue 1.3–2 keV). The superimposed images are binned with 6″ per pixel and smoothed by a Gaussian kernel of σ = 30″ to enhance the visibility of the diffuse emission. The photons detected in the annular sector shown in white were used for spectral analysis of the SNR. |
We searched for point sources with a signal-to-noise ratio (S/N) of at least
3σ in the five standard bands using a sliding box source detection
algorithm (SAS tool edetect_chain). Five point sources were detected (see Fig. 1), which all have an
S/N ≥ 7σG
( ,
where cbg are the background counts). Their position,
positional error, S/N, and count rate in the merged image are listed in Table 1.
,
where cbg are the background counts). Their position,
positional error, S/N, and count rate in the merged image are listed in Table 1.
Detected sources in XMM-Newton observation 0675070101.
In order to search for optical counterparts, we cross-correlated the position of each
X-ray source with the various online catalogs provided by the VizieR service1. We found a candidate counterpart for source #5, HD
103442 (Høg et al. 2000), which is an A3/4IV star
with an optical magnitude V = 8.8. Its angular separation from source #5
is  , corresponding to twice the
observatory’s absolute astrometric accuracy2. The
source density ρ in this region of the Galactic plane using the Tycho-2
catalog is ρ ≈ 0.09 arcmin-2. The probability of a chance
association computes then like
Pcoin = ρδ2,
where δ is the angular separation between the optical and X-ray source.
For the optical counterpart of source #5, we compute a chance probability of
4 × 10⁻⁴ for a mis-identification. Its X-ray flux within the 0.3 to 3.5 keV
band is 1.2 × 10⁻¹² erg cm-2 s-1, yielding an
X-ray-to-visual flux ratio of
log (fX/fV) = −3.1.
This is in the allowed range of −3.86 ± 0.79 for A-type stars (Maccacaro et al. 1988; Agüeros et al.
2009), which further strengthens the association between source #5 and its
candidate optical counterpart.
, corresponding to twice the
observatory’s absolute astrometric accuracy2. The
source density ρ in this region of the Galactic plane using the Tycho-2
catalog is ρ ≈ 0.09 arcmin-2. The probability of a chance
association computes then like
Pcoin = ρδ2,
where δ is the angular separation between the optical and X-ray source.
For the optical counterpart of source #5, we compute a chance probability of
4 × 10⁻⁴ for a mis-identification. Its X-ray flux within the 0.3 to 3.5 keV
band is 1.2 × 10⁻¹² erg cm-2 s-1, yielding an
X-ray-to-visual flux ratio of
log (fX/fV) = −3.1.
This is in the allowed range of −3.86 ± 0.79 for A-type stars (Maccacaro et al. 1988; Agüeros et al.
2009), which further strengthens the association between source #5 and its
candidate optical counterpart.
No source has been detected close to the geometrical center of the SNR. Using the merged MOS1/2 data, we determined a 3σ upper limit on the count rate of a hypothetical central X-ray source of 4.3 × 10⁻³ cts s-1 in the energy range 0.2 to 12 keV.
2.2. Spectral analysis
The energy spectrum of G296.7–0.9 was extracted from an elliptical annular sector with
the center at RAc and Decc, semimajor axes of 5′ and
 , semiminor axes of
and
, semiminor axes of
and
 , and an opening angle of 140°.
The background spectrum was derived from a nearby region placed on the same MOS1/2 chip
with the same size as the source region. The background contribution was found to be
≈ 50% in the two MOS cameras and ≈ 71% in the PN data. After subtracting the background,
1232, 1236, and 3077 source counts remained in the MOS1, MOS2, and PN data. For the
spectral analysis of the remnant, these counts were binned to have at least 75 counts per
bin in the case of the MOS1/2 observations and 150 counts per bin for the PN data.
, and an opening angle of 140°.
The background spectrum was derived from a nearby region placed on the same MOS1/2 chip
with the same size as the source region. The background contribution was found to be
≈ 50% in the two MOS cameras and ≈ 71% in the PN data. After subtracting the background,
1232, 1236, and 3077 source counts remained in the MOS1, MOS2, and PN data. For the
spectral analysis of the remnant, these counts were binned to have at least 75 counts per
bin in the case of the MOS1/2 observations and 150 counts per bin for the PN data.
We checked whether the spectral fitting results would change if we model the instrumental background according to the suggestions made by Kuntz & Snowden (2008). They proposed to add a Gaussian at the fluorescence line of Al Kα at E = 1.49 keV with zero width and a power law for modeling the remaining soft proton contamination, which is not convolved with the instrumental response. From this analysis, however, the model fits were not significantly better than without adding these components using the standard F-test. Thus, the following results were obtained without modeling the instrumental background separately.
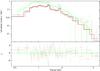 |
Fig. 2 Spectrum and fitted model (NEI) of the X-ray emission of SNR G296.7–0.9. The black colored line indicates the MOS1 data, the red the MOS2, and the green the PN data. |
We fitted the spectrum of G296.7–0.9 with various models: A hot diffuse gas model
(MEKAL), a model for a collisionally ionized diffuse gas (APEC), a power law model, a
thermal bremsstrahlung model, a Raymond-Smith diffuse gas model, a non-equilibrium
collisional plasma that allows a temperature evolution (GNEI) or has a constant
temperature (NEI, see Fig. 2), a plane-parallel shock
plasma model (PSHOCK), an ionization equilibrium collisional plasma model (EQUIL), and a
Sedov model with separate ion and electron temperatures. For spectral models with
 , all
fit parameters are listed in Table 2.
, all
fit parameters are listed in Table 2.
Spectral parameters of the best-fit models for SNR G296.7–0.9.
In the following, we will use the best-fit results of the NEI model to derive related SNR parameters. For all models with a non-equilibrium equation of state, we measure an ionization timescale value τ = t0ne < 1012s cm-3 (t0 is the age of the remnant and ne the post-shock electron number density), which is smaller than the expected timescale at which collisional ionization equilibrium is reached (Borkowski et al. 2001). Therefore, the APEC and EQUIL models are unlikely to apply. For the GNEI model, the temperature and the ionization timescale-averaged temperature are almost the same, which is no improvement over the NEI model. Additionally, we will not use the results of the SEDOV model any further, because the determination of the post-shock temperature Te in that model is only possible at energies above 3 to 4 keV (Borkowski et al. 2001), where the spectrum of G296.7–0.9 is not well constrained.
The value for NH in the NEI model fit is slightly lower than
the average integrated hydrogen column density toward SNR G296.7–0.9, which is
 (Kalberla et al. 2005). This value is based on HI
emission line measurements at a radio frequency of 21 cm and refers to the entire hydrogen
column density along the line of sight. The temperature of the plasma is
(Kalberla et al. 2005). This value is based on HI
emission line measurements at a radio frequency of 21 cm and refers to the entire hydrogen
column density along the line of sight. The temperature of the plasma is
 K. No improvement in
the best-fit statistic was observed when we allowed the abundances to differ from the
solar values. Using the derived parameters of the NEI model fit, the flux in the 0.5 to
4 keV band is
K. No improvement in
the best-fit statistic was observed when we allowed the abundances to differ from the
solar values. Using the derived parameters of the NEI model fit, the flux in the 0.5 to
4 keV band is  erg cm-2 s-1.
In addition, we investigated the spatial variation of the spectral parameters by extracting all photons in the northern and southern part of the remnant. However, no difference was found within the derived errors.
3. Discussion
3.1. Comparison with the ROSAT results
Schaudel (2003) and Robbins et al. (2012) independently analyzed two pointed ROSAT PSPCB observations. These data were taken between 1 and 8 February 1993 and 19 and 21 February 1998. Both authors found that the temperatures of the X-ray emitting gas and the hydrogen column density NH are lower by at least a factor of two when compared with the results deduced in our work. Only Schaudel (2003) found a NH that is comparable with our value listed in Table 2 by fitting the Raymond-Smith model, though his value had a much higher uncertainty. As mentioned in the introduction, the PSPCB had about five independent energy channels, which limits the conclusions drawn from their spectral fits, especially when 70 spectral bins were used as in the work of Robbins et al. (2012). The latter corresponds to an oversampling of about 15 times the spectral resolution of the detector!
3.2. Supernova remnant
Using the deduced spectral parameters from the NEI fit, we can derive basic properties of
the remnant, such as the distance d, post-shock hydrogen density
nH, swept-up mass M, the age of the remnant
t, the radius in pc Rs, and the shock
velocity vs. We used the following set of equations, which is
described in detail in Prinz & Becker
(2012) and references therein: ![Mathematical equation: \begin{eqnarray*} d_\text{Sedov}&=&7420 \ \theta^{-3/5}\left(\frac{E_{51}}{T_\text{s}}\right)^{2/5} \left(\frac{f}{\text{Norm}}\right)^{1/5}~[\text{kpc}] \\ d_\text{Reddening}&=&N_{\rm H}/\left( N_\text{H}/A_{\rm V}\ A_{\rm V}/E_{B-V}\ E_{B-V}/\text{kpc}\right)~[\text{kpc}]\\ V_\text{emit}&=&3.029\times10^{54}\ f\ \theta^3\ (d_\text{Sedov}[\text{kpc}])^3~[\text{cm}^3]\\ n_\text{H}&=&70.27 \sqrt{\frac{\text{Norm}}{d_\text{Sedov}\ f\ \theta^3}}~[\text{cm}^{-3}]\\ M&=&1.4\ n_\text{H}\ m_\text{H}\ V~[\text{kg}]\\ t&=&2.71\times 10^9 \left(\frac{E_{51}}{n_\text{H}}\right)^\frac{1}{3} T_\text{s}^{-\frac{6}{5}}~[\text{yr}]\\ R_\text{s}&=&0.34 \left(\frac{E_{51}}{N_\text{H}}\right)^\frac{1}{5} t^\frac{2}{5}~[\text{pc}]\\ v_\text{s}&=&0.4 \ R_\text{s}/t~[\text{km\,s}^{-1}]. \end{eqnarray*}](/articles/aa/full_html/2013/02/aa20297-12/aa20297-12-eq111.png) Here
Here
 is the reduced radius of the remnant in arcmin, E51 the
explosion energy in units of 1051 erg, Ts the
fitted plasma temperature, f the filling factor to correct for the
morphology of the SNR, Norm the normalization of the spectral fit,
NH the fitted column density,
Vemit the X-ray emitting volume, and
mH the mass of a hydrogen atom. The errors listed with the
numbers deduced from these equations are statistical errors. The systematic errors might
be larger but are unknown.
is the reduced radius of the remnant in arcmin, E51 the
explosion energy in units of 1051 erg, Ts the
fitted plasma temperature, f the filling factor to correct for the
morphology of the SNR, Norm the normalization of the spectral fit,
NH the fitted column density,
Vemit the X-ray emitting volume, and
mH the mass of a hydrogen atom. The errors listed with the
numbers deduced from these equations are statistical errors. The systematic errors might
be larger but are unknown.
The Sedov-analysis-based distance is  kpc. In the following, we give all important quantities in units of
d9.8 = d/9.8 kpc because
dSedov has a smaller uncertainty than other distance
estimates. From Fig. 1 we infer that only
f = 15% of the remnant is bright enough to be used for spectral
analysis. Therefore, the post-shock hydrogen density NH is
kpc. In the following, we give all important quantities in units of
d9.8 = d/9.8 kpc because
dSedov has a smaller uncertainty than other distance
estimates. From Fig. 1 we infer that only
f = 15% of the remnant is bright enough to be used for spectral
analysis. Therefore, the post-shock hydrogen density NH is
 and the swept-up mass is
  .
Assuming that the explosion energy E is equal to the canonical value of
1051 erg, the age of the remnant is 5800 to 7600 years and the radius is
.
Assuming that the explosion energy E is equal to the canonical value of
1051 erg, the age of the remnant is 5800 to 7600 years and the radius is
 pc. We derive a shock velocity vs of
 km s-1.
Using the flux values deduced in Sect. 2 we compute
its luminosity to be
km s-1.
Using the flux values deduced in Sect. 2 we compute
its luminosity to be  erg s-1.
Independently of the Sedov analysis, another method that allows us to estimate the remnant’s distance makes use of a relation between the visible extinction AV and the color excess AV/EB − V = 3.2 ± 0.2. The remnant’s color excess was not known, so we used the distribution of the mean color excess EB − V per kiloparsec derived by Lucke (1978). In the direction of the remnant, we find EB − V/kpc = 0.25 ± 0.10. In addition, we used the relation between NH and the visual extinction AV of Predehl & Schmitt (1995)NH/AV = (1.79 ± 0.03) × 1021 cm-2. This leads to a distance of dReddening = 9 ± 4 kpc, which is in agreement with the distance deduced from the Sedov analysis. However, the mean color excess ⟨ EB − V ⟩ that we used to calculate dReddening was derived for a reddening layer up to 2 kpc and thus is just a rough estimate.
3.3. Compact central object
To obtain a rough estimate of the flux upper limit for a hypothetical compact source in the center of the remnant, we assumed that the source has properties similar to a central compact object (CCO), because no compact source or radio pulsar has been detected in G296.7–0.9 so far (Robbins et al. 2012). Like other CCOs, e.g., the one in the SNR Puppis A, we assume that the spectrum is dominated by blackbody emission with a temperature of ≈ 2.6 × 10⁶ K and a luminosity in the 0.5–10 keV band of at least 1032 erg s-1 (see Becker (2009) for a review). This corresponds to a flux in this energy range of ≈ 9 × 10-15 erg cm-2 s-1. Using the WebPIMMS tool with the fitted NH of the SNR, the count rate in the 0.2–12 keV range is >2 × 10⁻⁴ cts s-1 for the merged MOS1 and MOS2 observations, an order of magnitude lower than the derived 3σ upper limit for a point-like source at the center of the remnant. That we do not detect emission from a CCO in G296.7–0.9 does therefore not mean that there is none. The observation might not be deep enough to detect it. The type of the supernova is also unconstrained.
4. Conclusion and summary
The remnant is characterized by a bright arc in the south-west direction and by diffuse emission with low surface brightness in its western part. We showed that the X-ray emission of G296.7–0.9 is in agreement with coming from a collisionally heated plasma that has not yet reached equilibrium. The Sedov analysis leads to the conclusion that the SNR is about 6600 years old and expanding with a velocity on the order of ≈ 720 km s-1.
The close-by HII region G296.593–0.975 has a velocity of +25 ± 1kms-1, based on measured hydrogen recombination lines (Caswell & Haynes 1987). With the standard IAU parameter for the distance to the center of our Galaxy R0 = 8.5 kpc and the solar orbit velocity of V0 = 220 km s-1 (Kerr & Lynden-Bell 1986) and the Galactic rotation model of Fich et al. (1989), we
deduce a distance to the HII region of 9.3 ± 0.6 kpc. For the error estimate, we assumed an uncertainty in the velocity-to-distance conversion of 7 km s-1 (e.g., Clifton et al. 1988).
The deduced distance dSedov is in good agreement with the distance of the close-by HII region G296.593–0.975. This is a strong indicator for a spatial connection between the SNR and the HII region, as already suggested by Robbins et al. (2012).
The observation used in this analysis was strongly affected by particle background radiation, which led to a net observation time that was shorter by a factor of three than the approved exposure time. Therefore, only limited statements can be made about the existence of a compact source located near the center of the SNR. Deeper observations might help to clarify this question and shed light on the type of the SN.
xmm.vilspa.esa.es/docs/documents/CAL-TN-0018.pdf.
Acknowledgments
We acknowledge the use of the XMM-Newton data archive. T.P. acknowledges support from and participation in the International Max Planck Research School on Astrophysics at the Ludwig Maximilian University of Munich, Germany.
References
- Agüeros, M. A., Anderson, S. F., Covey, K. R., et al. 2009, ApJS, 181, 444 [NASA ADS] [CrossRef] [Google Scholar]
- Becker, W. 2009, in Astrophysics and Space Science Library 357, ed. W. Becker, 91 [Google Scholar]
- Borkowski, K. J., Lyerly, W. J., & Reynolds, S. P. 2001, ApJ, 548, 820 [NASA ADS] [CrossRef] [Google Scholar]
- Caswell, J. L., & Haynes, R. F. 1987, A&A, 171, 261 [NASA ADS] [Google Scholar]
- Clifton, T. R., Frail, D. A., Kulkarni, S. R., & Weisberg, J. M. 1988, ApJ, 333, 332 [NASA ADS] [CrossRef] [Google Scholar]
- Diehl, R., Halloin, H., Kretschmer, K., et al. 2006, Nature, 439, 45 [NASA ADS] [CrossRef] [PubMed] [Google Scholar]
- Fich, M., Blitz, L., & Stark, A. A. 1989, ApJ, 342, 272 [NASA ADS] [CrossRef] [Google Scholar]
- Green, D. A., & Stephenson, F. R. 2003, in Supernovae and Gamma-Ray Bursters, ed. K. Weiler, Lect. Notes Phys. (Berlin: Springer Verlag), 598, 7 [Google Scholar]
- Høg, E., Fabricius, C., Makarov, V. V., et al. 2000, A&A, 355, L27 [NASA ADS] [Google Scholar]
- Kalberla, P. M. W., Burton, W. B., Hartmann, D., et al. 2005, A&A, 440, 775 [NASA ADS] [CrossRef] [EDP Sciences] [Google Scholar]
- Kerr, F. J., & Lynden-Bell, D. 1986, MNRAS, 221, 1023 [NASA ADS] [CrossRef] [Google Scholar]
- Kuntz, K. D., & Snowden, S. L. 2008, A&A, 478, 575 [NASA ADS] [CrossRef] [EDP Sciences] [Google Scholar]
- Lucke, P. B. 1978, A&A, 64, 367 [NASA ADS] [Google Scholar]
- Maccacaro, T., Gioia, I. M., Wolter, A., Zamorani, G., & Stocke, J. T. 1988, ApJ, 326, 680 [NASA ADS] [CrossRef] [Google Scholar]
- Predehl, P., & Schmitt, J. H. M. M. 1995, A&A, 293, 889 [NASA ADS] [Google Scholar]
- Prinz, T., & Becker, W. 2012, A&A, 544, A7 [NASA ADS] [CrossRef] [EDP Sciences] [Google Scholar]
- Rest, A., Welch, D. L., Suntzeff, N. B., et al. 2008, ApJ, 681, L81 [NASA ADS] [CrossRef] [Google Scholar]
- Reynolds, S. P., Borkowski, K. J., Green, D. A., et al. 2008, ApJ, 680, L41 [NASA ADS] [CrossRef] [Google Scholar]
- Robbins, W. J., Gaensler, B. M., Murphy, T., Reeves, S., & Green, A. J. 2012, MNRAS, 419, 2623 [NASA ADS] [CrossRef] [Google Scholar]
- Rodney, S. A., Riess, A. G., Strolger, L., et al. 2011, in Am. Astron. Soc. Meet. Abstr. #218, #219.01 [Google Scholar]
- Sako, M., Bassett, B., Becker, A., et al. 2008, AJ, 135, 348 [NASA ADS] [CrossRef] [Google Scholar]
- Schaudel, D. 2003, Ph.D. Thesis, LMU, Germany [Google Scholar]
- Schaudel, D., Becker, W., Voges, W., et al. 2002, in Neutron Stars in Supernova Remnants, eds. P. O. Slane, & B. M. Gaensler, ASP Conf. Ser., 271, 391 [Google Scholar]
- Strüder, L., Briel, U., Dennerl, K., et al. 2001, A&A, 365, L18 [NASA ADS] [CrossRef] [EDP Sciences] [Google Scholar]
All Tables
All Figures
|
Fig. 1 30′ × 30′ XMM-Newton MOS1/2 color image of G296.7–0.9 (red 0.5–0.9 keV, green 0.9–1.3 keV, and blue 1.3–2 keV). The superimposed images are binned with 6″ per pixel and smoothed by a Gaussian kernel of σ = 30″ to enhance the visibility of the diffuse emission. The photons detected in the annular sector shown in white were used for spectral analysis of the SNR. |
| In the text | |
|
Fig. 2 Spectrum and fitted model (NEI) of the X-ray emission of SNR G296.7–0.9. The black colored line indicates the MOS1 data, the red the MOS2, and the green the PN data. |
| In the text | |
Current usage metrics show cumulative count of Article Views (full-text article views including HTML views, PDF and ePub downloads, according to the available data) and Abstracts Views on Vision4Press platform.
Data correspond to usage on the plateform after 2015. The current usage metrics is available 48-96 hours after online publication and is updated daily on week days.
Initial download of the metrics may take a while.