Free Access
Fig. 6
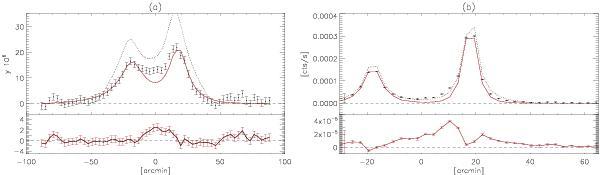
1D a) tSZ and b) X-ray profiles and residuals for the best-fit models of the A399 and A401 clusters. The red curve corresponds to the GNFW2 model. The dotted lines are the model from Sakelliou & Ponman (2004).
Current usage metrics show cumulative count of Article Views (full-text article views including HTML views, PDF and ePub downloads, according to the available data) and Abstracts Views on Vision4Press platform.
Data correspond to usage on the plateform after 2015. The current usage metrics is available 48-96 hours after online publication and is updated daily on week days.
Initial download of the metrics may take a while.