Fig. 13
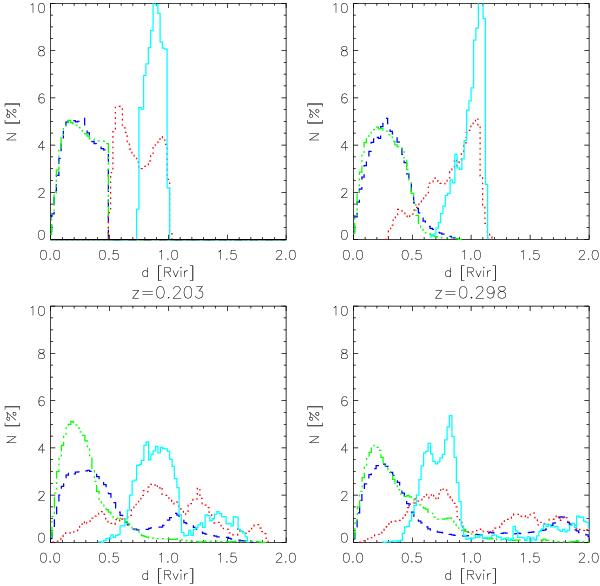
Evolution of the radial distribution of the particles with respect to the centre of the closest of the two clusters. The colour code is the same as in Fig. 12. The dashed and dot-dashed lines correspond to the blue and green particles (clusters) while the dotted and solid lines orrespond to the red and cyan particles (filament).
Current usage metrics show cumulative count of Article Views (full-text article views including HTML views, PDF and ePub downloads, according to the available data) and Abstracts Views on Vision4Press platform.
Data correspond to usage on the plateform after 2015. The current usage metrics is available 48-96 hours after online publication and is updated daily on week days.
Initial download of the metrics may take a while.