Fig. 12
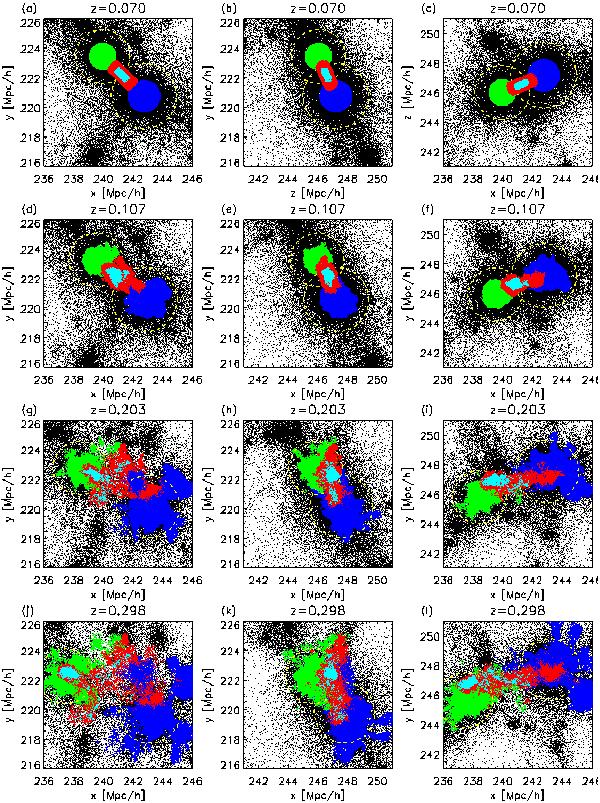
Spatial projections (along x, y and z axis) of the particles in the simulation. The rows show the simulation at z = 0.07, z = 0.1, z = 0.2 and z = 0.3 respectively. We colour code the particles depending on their location: clusters (green/blue), the filamentary region in between (red) and the central part of this filament (cyan). See text for a more detailed definition. Additionally the yellow circles mark the virial radius of the two clusters.
Current usage metrics show cumulative count of Article Views (full-text article views including HTML views, PDF and ePub downloads, according to the available data) and Abstracts Views on Vision4Press platform.
Data correspond to usage on the plateform after 2015. The current usage metrics is available 48-96 hours after online publication and is updated daily on week days.
Initial download of the metrics may take a while.