Fig. 5
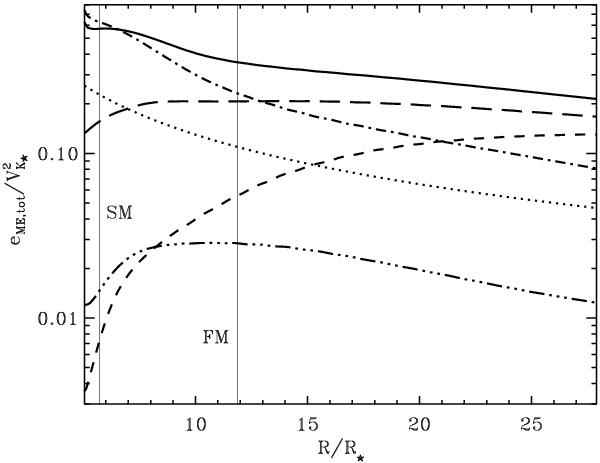
Radial evolution of the total specific energy carried by the MEs in case C03. The total specific energy (solid line) is given by the sum of Poyinting-to-mass flux ratio (dot-dashed line), kinetic energy (long-dashed line), specific enthalpy (triple-dotted-dashed line) and potential gravitational energy (dotted line, plotted in absolute value). The specific poloidal kinetic energy is also plotted (dashed line). The slow- and fast-magnetosonic surfaces are marked by a vertical line. The plot starts from the cusp of the innermost magnetic surface that steadily connects the disk and the star (labeled as (b) in Fig. 1). The figure has been obtained by time averaging the energy and mass fluxes over 54 rotation periods of the star, from time t = 38 up to t = 92.
Current usage metrics show cumulative count of Article Views (full-text article views including HTML views, PDF and ePub downloads, according to the available data) and Abstracts Views on Vision4Press platform.
Data correspond to usage on the plateform after 2015. The current usage metrics is available 48-96 hours after online publication and is updated daily on week days.
Initial download of the metrics may take a while.