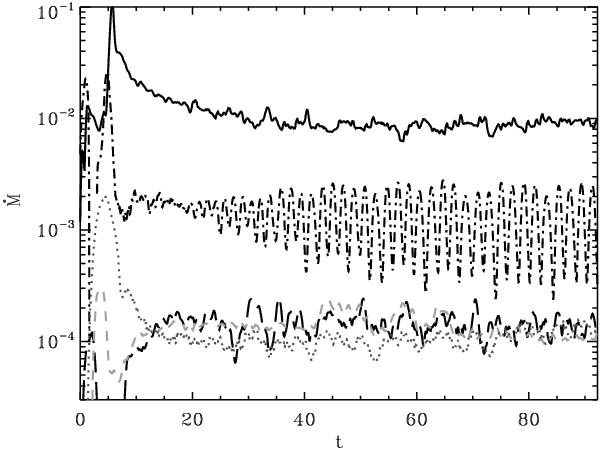
Fig. 3

Temporal evolution of mass fluxes of the different accretion and ejection phenomena present in the system: mass accretion rate measured at the stellar surface (solid line), total mass outflow rate of magnetospheric ejections (dot-dashed line), mass flux fueling the MEs coming from the star only (long-dashed line), stellar wind outflow rate (dashed gray line), disk wind mass outflow rate (dotted line). The image refers to case C03. Time is given in units of rotation periods of the central star.
Current usage metrics show cumulative count of Article Views (full-text article views including HTML views, PDF and ePub downloads, according to the available data) and Abstracts Views on Vision4Press platform.
Data correspond to usage on the plateform after 2015. The current usage metrics is available 48-96 hours after online publication and is updated daily on week days.
Initial download of the metrics may take a while.


