Fig. 2
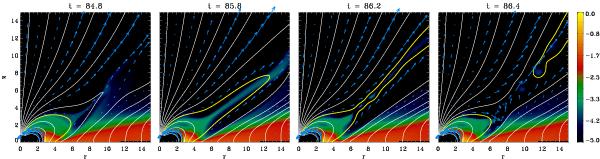
Temporal evolution of the periodic inflation/reconnection process which characterizes the dynamics of the magnetospheric ejections in case C03. We show logarithmic density maps with sample field lines (white solid lines) and poloidal speed vectors (blue arrows) superimposed. The yellow solid lines follow the evolution of a single magnetic surface showing clearly the dynamics of the phenomenon. Time is given in units of rotation periods of the central star.
Current usage metrics show cumulative count of Article Views (full-text article views including HTML views, PDF and ePub downloads, according to the available data) and Abstracts Views on Vision4Press platform.
Data correspond to usage on the plateform after 2015. The current usage metrics is available 48-96 hours after online publication and is updated daily on week days.
Initial download of the metrics may take a while.