Fig. A.1
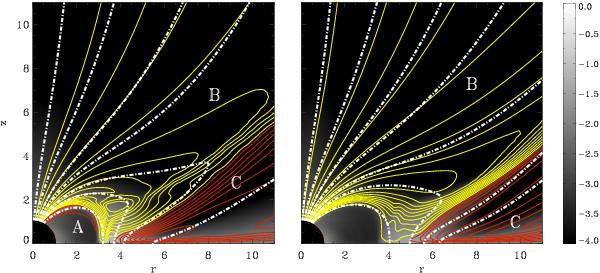
Poloidal current circuits flowing in the star-disk system in case C01. Color codes are the same as in Fig. 15. The left panel refers to the accretion phases, while the right panel represents the strictly propeller phases. The left (right) panel has been obtained by averaging in time current and density during the maxima (minima) of the accretion rate for t > 60, see Fig. 13.
Current usage metrics show cumulative count of Article Views (full-text article views including HTML views, PDF and ePub downloads, according to the available data) and Abstracts Views on Vision4Press platform.
Data correspond to usage on the plateform after 2015. The current usage metrics is available 48-96 hours after online publication and is updated daily on week days.
Initial download of the metrics may take a while.