Fig. 14
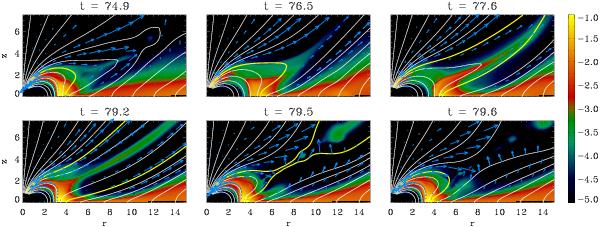
Time evolution of an accretion cycle during the propeller phase of case C01. We show logarithmic density maps with sample field lines (solid lines) and speed vectors (blue arrows) superimposed. The yellow solid line follows the evolution of a single magnetic surface, clearly showing the periodicity of the accretion-ejection cycles. Time is given in units of the stellar rotation period.
Current usage metrics show cumulative count of Article Views (full-text article views including HTML views, PDF and ePub downloads, according to the available data) and Abstracts Views on Vision4Press platform.
Data correspond to usage on the plateform after 2015. The current usage metrics is available 48-96 hours after online publication and is updated daily on week days.
Initial download of the metrics may take a while.