Fig. 13
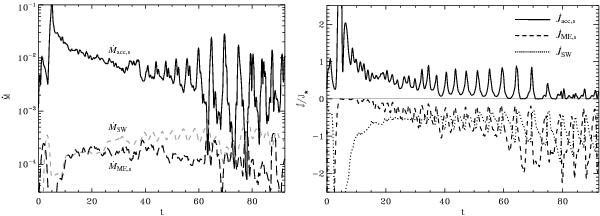
Left panel. Temporal evolution of different mass fluxes in case C01. Plotted are the mass accretion rate onto the stellar surface (solid line), the stellar wind outflow rate (dashed gray line), and the stellar mass flux contribution to the MEs (dashed line). Right panel. Temporal evolution of the torques acting onto the stellar surface, normalized to the stellar angular momentum. Plotted are the spin-up torque associated with accretion (solid line), the spin-down torque exerted along the magnetic surfaces connecting the star and the disk (dashed line) and the spin-down torque due to the stellar wind (dotted line).
Current usage metrics show cumulative count of Article Views (full-text article views including HTML views, PDF and ePub downloads, according to the available data) and Abstracts Views on Vision4Press platform.
Data correspond to usage on the plateform after 2015. The current usage metrics is available 48-96 hours after online publication and is updated daily on week days.
Initial download of the metrics may take a while.