Fig. 1
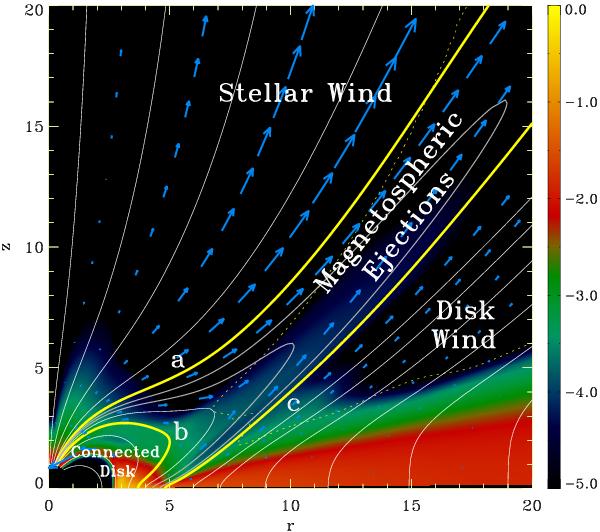
Global view of the star-disk interacting system. A logarithmic density map is shown in the background. Poloidal speed vectors are represented as blue arrows. The dotted line marks the Alfvén surface, where  . Sample field lines are plotted with white solid lines. Thick yellow field lines, labeled as (a), (b), and (c), delimit the different dynamical constituents of the system indicated in the figure. The image has been obtained by averaging in time the simulation outcome over 54 stellar periods.
Current usage metrics show cumulative count of Article Views (full-text article views including HTML views, PDF and ePub downloads, according to the available data) and Abstracts Views on Vision4Press platform.
Data correspond to usage on the plateform after 2015. The current usage metrics is available 48-96 hours after online publication and is updated daily on week days.
Initial download of the metrics may take a while.