Free Access
Fig. 6
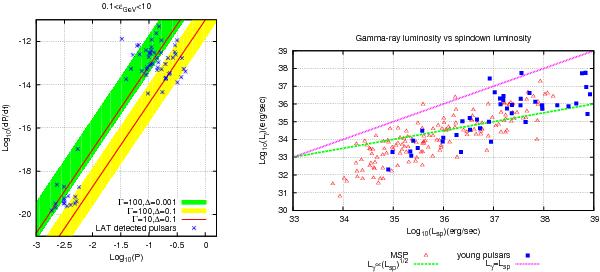
P − Ṗ diagram including the pulsars observed by Fermi/LAT and plot of the predicted γ-ray luminosity in the range 0.1 − 10 GeV for a random sample of pulsars. Gamma-ray luminosity Lγ versus the spindown luminosity Lsp for two random samples of millisecond and young pulsars. The lines Lγ = Lsp and  are also shown.
This figure is made of several images, please see below:
Current usage metrics show cumulative count of Article Views (full-text article views including HTML views, PDF and ePub downloads, according to the available data) and Abstracts Views on Vision4Press platform.
Data correspond to usage on the plateform after 2015. The current usage metrics is available 48-96 hours after online publication and is updated daily on week days.
Initial download of the metrics may take a while.