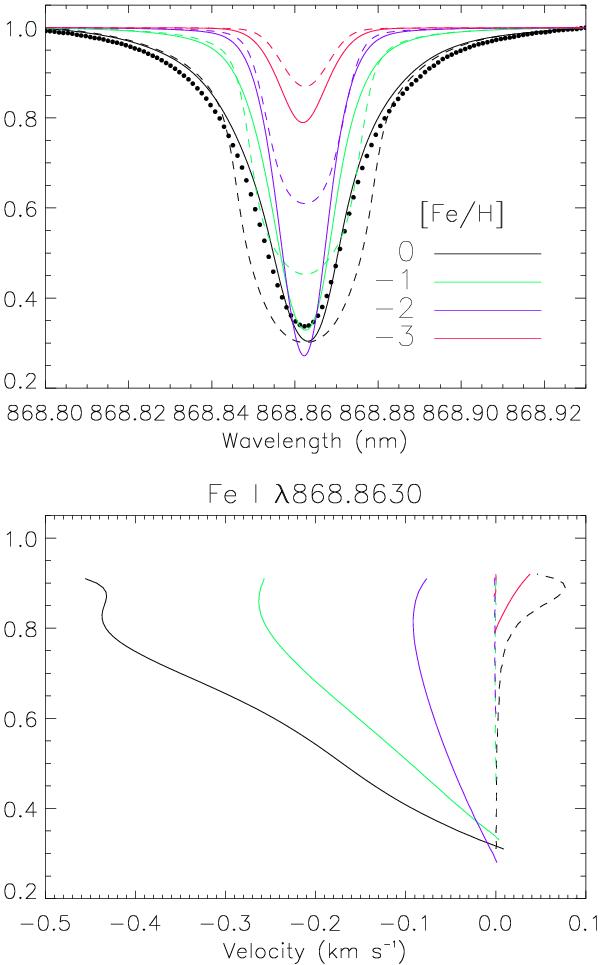
Fig. 7

Line profiles and velocity bisectors for the Fe I transition at 868.6 nm. The filled circles in the upper panel correspond to solar observations. Solid lines are for 3D simulations and broken lines for 1D models. Note that the 1D calculation at solar-metallicity for this line (broken solid line) shows a non-zero velocity bisector, due to overlapping CN transitions included in all our calculations that distort the otherwise perfectly symmetric 1D profiles.
Current usage metrics show cumulative count of Article Views (full-text article views including HTML views, PDF and ePub downloads, according to the available data) and Abstracts Views on Vision4Press platform.
Data correspond to usage on the plateform after 2015. The current usage metrics is available 48-96 hours after online publication and is updated daily on week days.
Initial download of the metrics may take a while.


