Free Access
Fig. 6
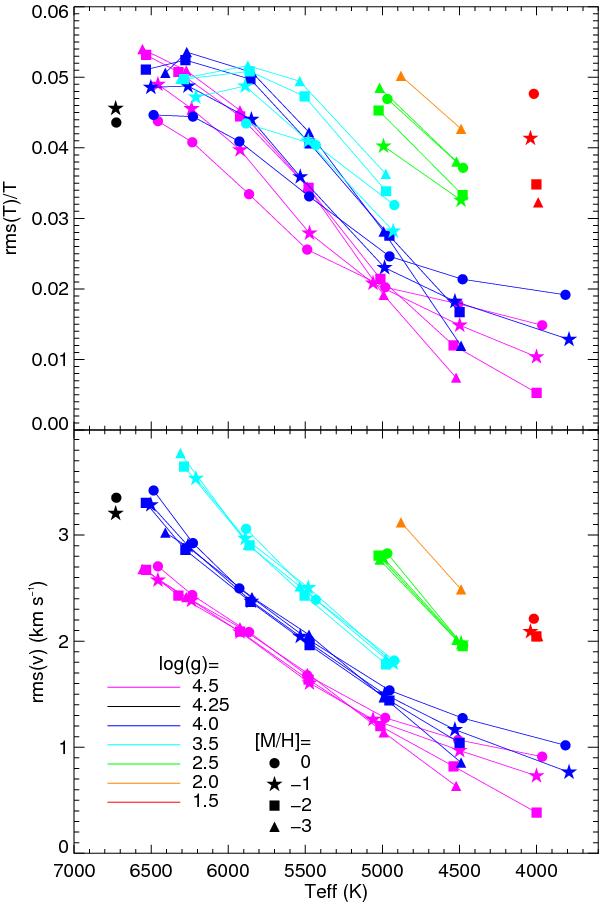
Relative horizontal temperature fluctuation (top panel) and absolute vertical velocity fluctuations (bottom panel) at Rosseland optical depth τ = 2/3 in the 3D models. The surface gravity is color coded, metallicity is depicted by different plot symbols.
Current usage metrics show cumulative count of Article Views (full-text article views including HTML views, PDF and ePub downloads, according to the available data) and Abstracts Views on Vision4Press platform.
Data correspond to usage on the plateform after 2015. The current usage metrics is available 48-96 hours after online publication and is updated daily on week days.
Initial download of the metrics may take a while.