Fig. 5
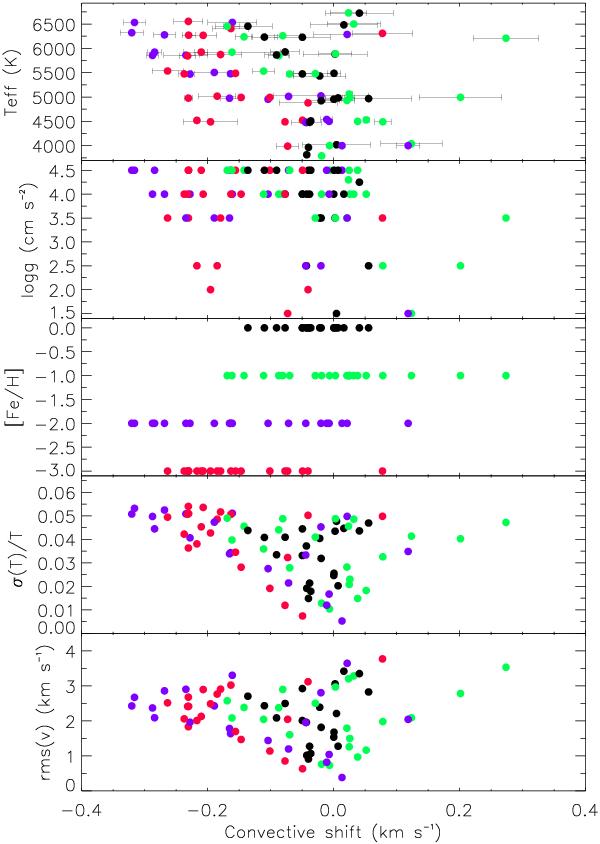
Three uppermost panels: predicted convective shifts and atmospheric parameters of the 3D hydrodynamical models for Gaia RVS observations. Two lowermost panels: convective shifts versus relative horizontal temperature fluctuations and the rms of the vertical velocity at Rosseland optical depth τ = 2/3. In all panels data points are color coded by metallicity as in Fig. 4.
Current usage metrics show cumulative count of Article Views (full-text article views including HTML views, PDF and ePub downloads, according to the available data) and Abstracts Views on Vision4Press platform.
Data correspond to usage on the plateform after 2015. The current usage metrics is available 48-96 hours after online publication and is updated daily on week days.
Initial download of the metrics may take a while.