Free Access
Fig. 8
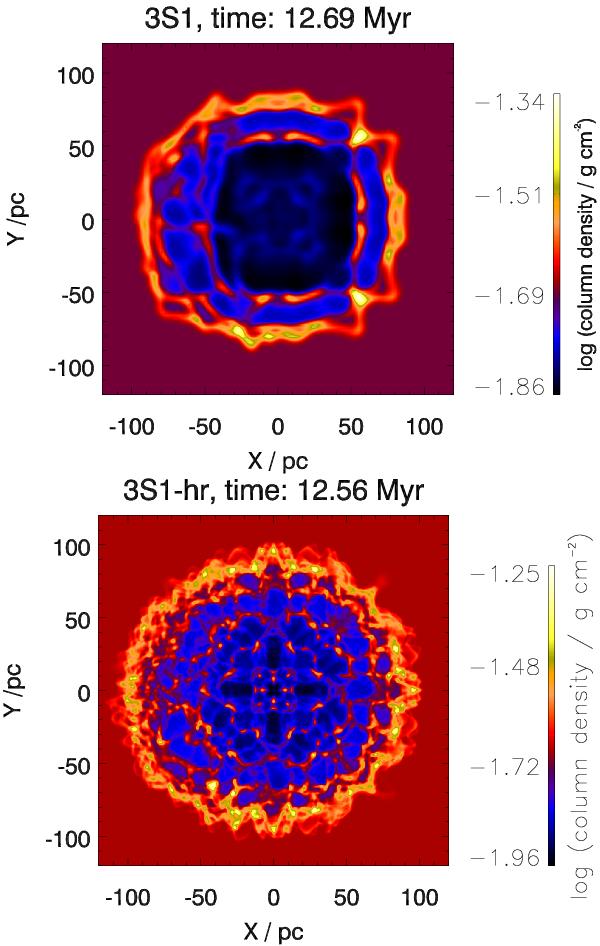
Column density at a comparable late evolution time for runs 3S1 (top) and 3S1-hr (bottom). The high resolution bubble is more spherical, larger, achieves higher peak column densities and the Vishniac instability is more pronounced.
This figure is made of several images, please see below:
Current usage metrics show cumulative count of Article Views (full-text article views including HTML views, PDF and ePub downloads, according to the available data) and Abstracts Views on Vision4Press platform.
Data correspond to usage on the plateform after 2015. The current usage metrics is available 48-96 hours after online publication and is updated daily on week days.
Initial download of the metrics may take a while.