Fig. 7
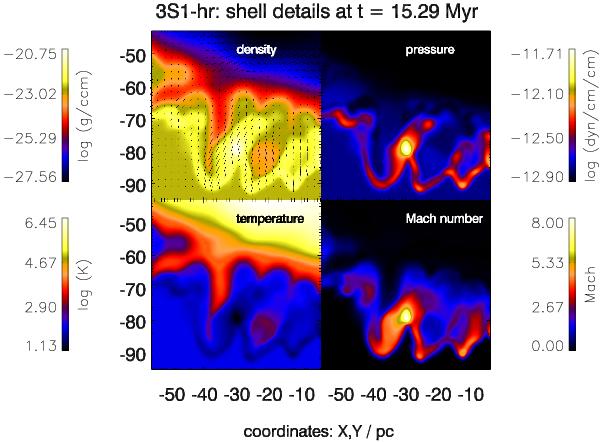
Shell details for the final snapshot of run 3S1-hr. Shown is an X-Y zoom of density, pressure, temperature and Mach number, as indicated on the individual panels, around the position of the maximum density, which is located at (X, Y, Z) = (−30, −79, −52) pc. Velocity vectors are overlaid on the density plot. The high density region is overpressured and has a temperature below 20 K. See text for more details.
Current usage metrics show cumulative count of Article Views (full-text article views including HTML views, PDF and ePub downloads, according to the available data) and Abstracts Views on Vision4Press platform.
Data correspond to usage on the plateform after 2015. The current usage metrics is available 48-96 hours after online publication and is updated daily on week days.
Initial download of the metrics may take a while.