Fig. 6
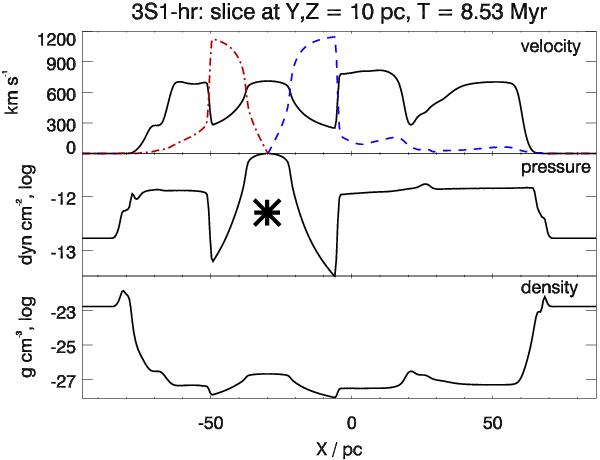
One-dimensional slices in X-direction through run 3S1-hr at time T = 8.53 Myr. The Y and Z coordinates are chosen appropriately for the slices to include the position of the only remaining star at that time (25 M⊙ , at X = −30 pc, indicated by the star in the middle diagram). Top: positive X-velocity (blue, dashed line), negative x-velocity (red dash-dotted line) and sound speed (solid black). Middle: pressure (logarithmic). Bottom: density (logarithmic). See text for details.
Current usage metrics show cumulative count of Article Views (full-text article views including HTML views, PDF and ePub downloads, according to the available data) and Abstracts Views on Vision4Press platform.
Data correspond to usage on the plateform after 2015. The current usage metrics is available 48-96 hours after online publication and is updated daily on week days.
Initial download of the metrics may take a while.