Fig. 3
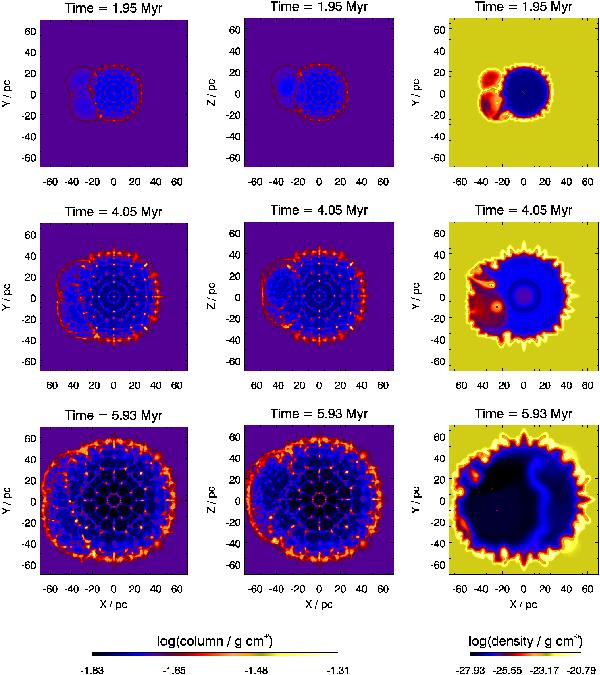
Column density integrated over Z-direction and Y-direction (left and middle col., respectively) and midplane density (right column) for three different snapshot times from top to bottom for run 3S1-hr. The projections of the three massive stars into the X–Y plane is indicated as small red stars in the density plots on the right. The 60 M⊙ star blows the biggest bubble from the origin. The 32 M⊙ bubble towards its lower left (XY-plots) is only slightly bigger than the one of the 25 M⊙ star above. The shell forms spikes and dense clumps due to the combined action of Vishniac and thermal instability. A movie is provided with the online version.
Current usage metrics show cumulative count of Article Views (full-text article views including HTML views, PDF and ePub downloads, according to the available data) and Abstracts Views on Vision4Press platform.
Data correspond to usage on the plateform after 2015. The current usage metrics is available 48-96 hours after online publication and is updated daily on week days.
Initial download of the metrics may take a while.