Fig. 1
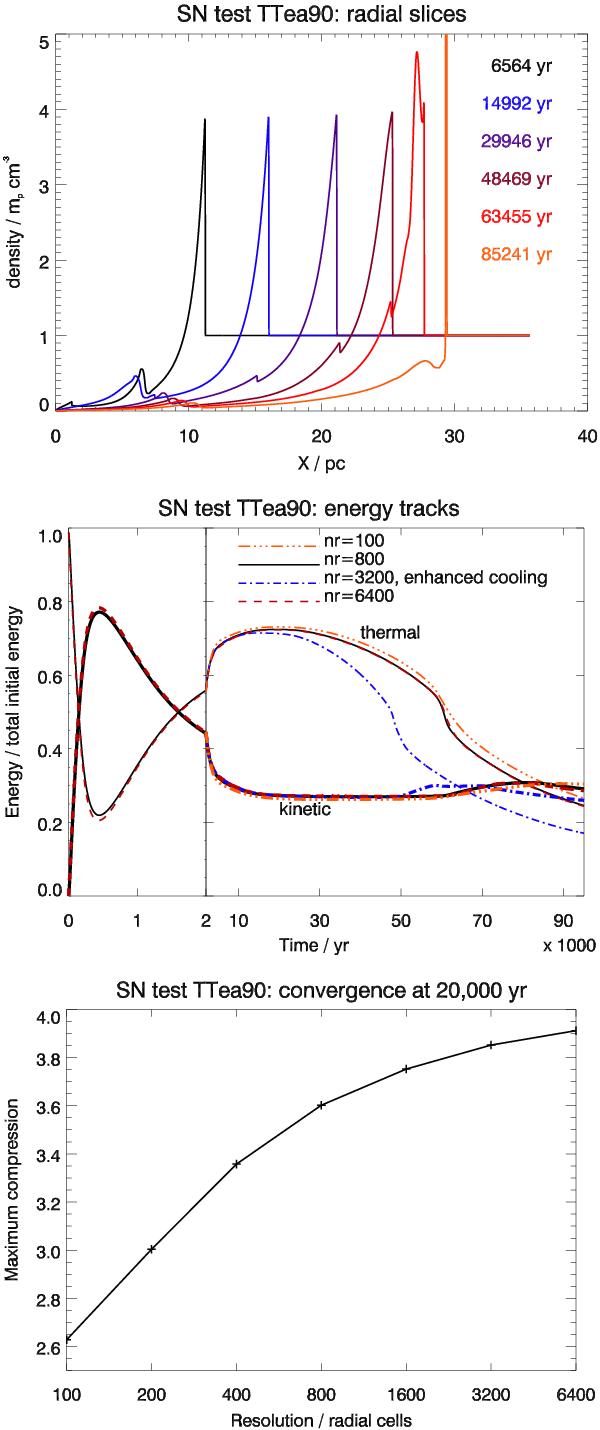
Test simulation of an isolated supernova in a homogeneous environment according to Tenorio-Tagle et al. (1990).This test was run in 1D and spherical coordinates at radial resolutions between 100 and 6400 cells with respective increments of a factor of two and with the standard cooling and heating. Top: density slices at different times (increasing from left to right). Middle: evolution of thermal (thin lines) and kinetic (thick lines) energy for the 100 (orange triple dot-dashed lines), 800 (solid black lines), 6400 (red dashed lines) radial cells simulation. Additionally a simulation with 3200 radial cells and enhanced cooling is shown (blue dot-dashed lines, see text for details). The left part of the plot zooms into the first 2000 yr of the evolution. Bottom: maximum compression at about 20 000 yr as a function of resolution. The expected maximum compression at this time is four for a strong adiabatic shock.
Current usage metrics show cumulative count of Article Views (full-text article views including HTML views, PDF and ePub downloads, according to the available data) and Abstracts Views on Vision4Press platform.
Data correspond to usage on the plateform after 2015. The current usage metrics is available 48-96 hours after online publication and is updated daily on week days.
Initial download of the metrics may take a while.