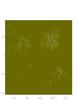
Fig. 5
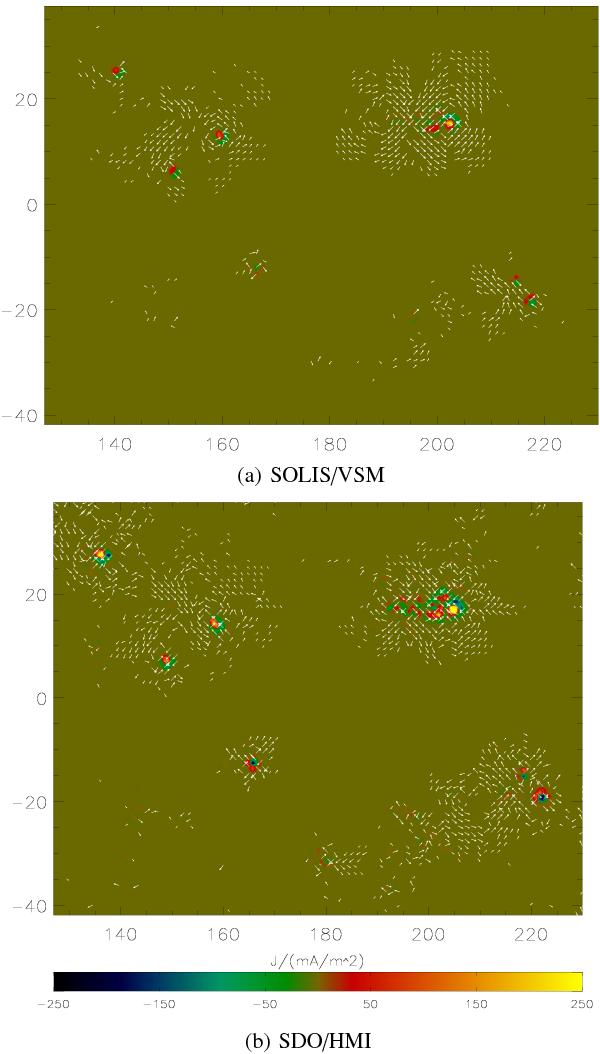
Vector plot of the radial component of electric current density and vector field plot of transverse component of electric current density with white arrows. The colour coding shows Jr on the photosphere. The vertical and horizontal axes show latitude, θ and longitude, φ on the photosphere respectively.
Current usage metrics show cumulative count of Article Views (full-text article views including HTML views, PDF and ePub downloads, according to the available data) and Abstracts Views on Vision4Press platform.
Data correspond to usage on the plateform after 2015. The current usage metrics is available 48-96 hours after online publication and is updated daily on week days.
Initial download of the metrics may take a while.