Fig. 3
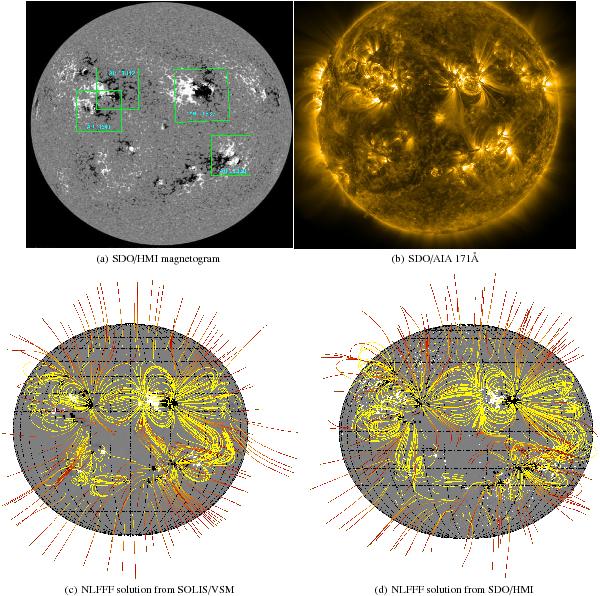
a) SDO/HMI and b) AIA images and their respective selected magnetic field lines plots reconstructed from c) SOLIS and d) HMI magnetograms using NLFFF modeling. The color coding shows Br on the photosphere. Yellow field lines represent closed field lines, while field lines changing in color from yellow to brown (from bottom to the top) represent the open ones. The gray area indicates the region where magnetic field values are close to zero.

Current usage metrics show cumulative count of Article Views (full-text article views including HTML views, PDF and ePub downloads, according to the available data) and Abstracts Views on Vision4Press platform.
Data correspond to usage on the plateform after 2015. The current usage metrics is available 48-96 hours after online publication and is updated daily on week days.
Initial download of the metrics may take a while.