Fig. 7
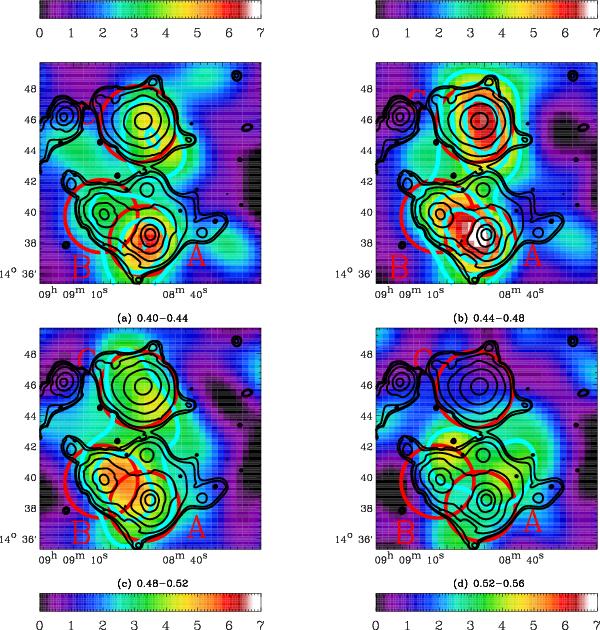
Galaxy density maps for cluster members in the SDSS catalogue (colours) in different photometric redshift cuts: 0.40–0.44 (upper left); 0.44–0.48 (upper right); 0.48–0.52 (lower left); and 0.52–0.56 (lower right). The cyan contours overlaid mark the significance of each density peak at 3, 4, and 5σ, respectively. The black contours show the X-ray distribution and the red circles and letters mark the three components.
Current usage metrics show cumulative count of Article Views (full-text article views including HTML views, PDF and ePub downloads, according to the available data) and Abstracts Views on Vision4Press platform.
Data correspond to usage on the plateform after 2015. The current usage metrics is available 48-96 hours after online publication and is updated daily on week days.
Initial download of the metrics may take a while.